
Earlier this year, the US Census Bureau released the population estimates for metro areas as of July 1, 2015. News outlets always pick up these data releases, but they tend to focus on the 1-year growth rates from 2014-2015. I’m more interested in the longer trend over the last several years. In this blog, I show you comparisons of growth rates from 2010 to 2015 for all 382 US metro areas. Because a single year is far less telling than a 5-year trend.
To make the comparisons more meaningful, I’ve grouped metro areas into 5 categories based on their size:
- Large metro areas with 2 million or more residents;
- Mid-size/Large metro areas with 1 million to 2 million residents;
- Mid-size metro areas with 500,000 to 1 million residents;
- Small/Mid-size metro areas with 250,000 to 500,000 residents; and
- Small metro areas with less than 250,000 residents.
But instead of simply looking at the growth trends, I’m using this dataset to identify outliers and exceptions. How so? The obvious outliers are the metro areas growing way faster or slower than everyone else in their category. But other notable exceptions can be found by comparing metro areas within their region of the US. In general, the Midwest and Northeast are filled with slow-growth and declining metro areas (with a few notable exceptions). The South and West are filled with moderate growth and high-growth metro areas (also with some notable exceptions).
The 5 sections below describe general growth trends and outliers for each of the 5 metro area groups. This includes a table showing the top 10 fastest growing and bottom 10 slowest growing metro areas in each category. You can scroll down to the bottom of the page for the full tables showing all metro areas within each grouping.
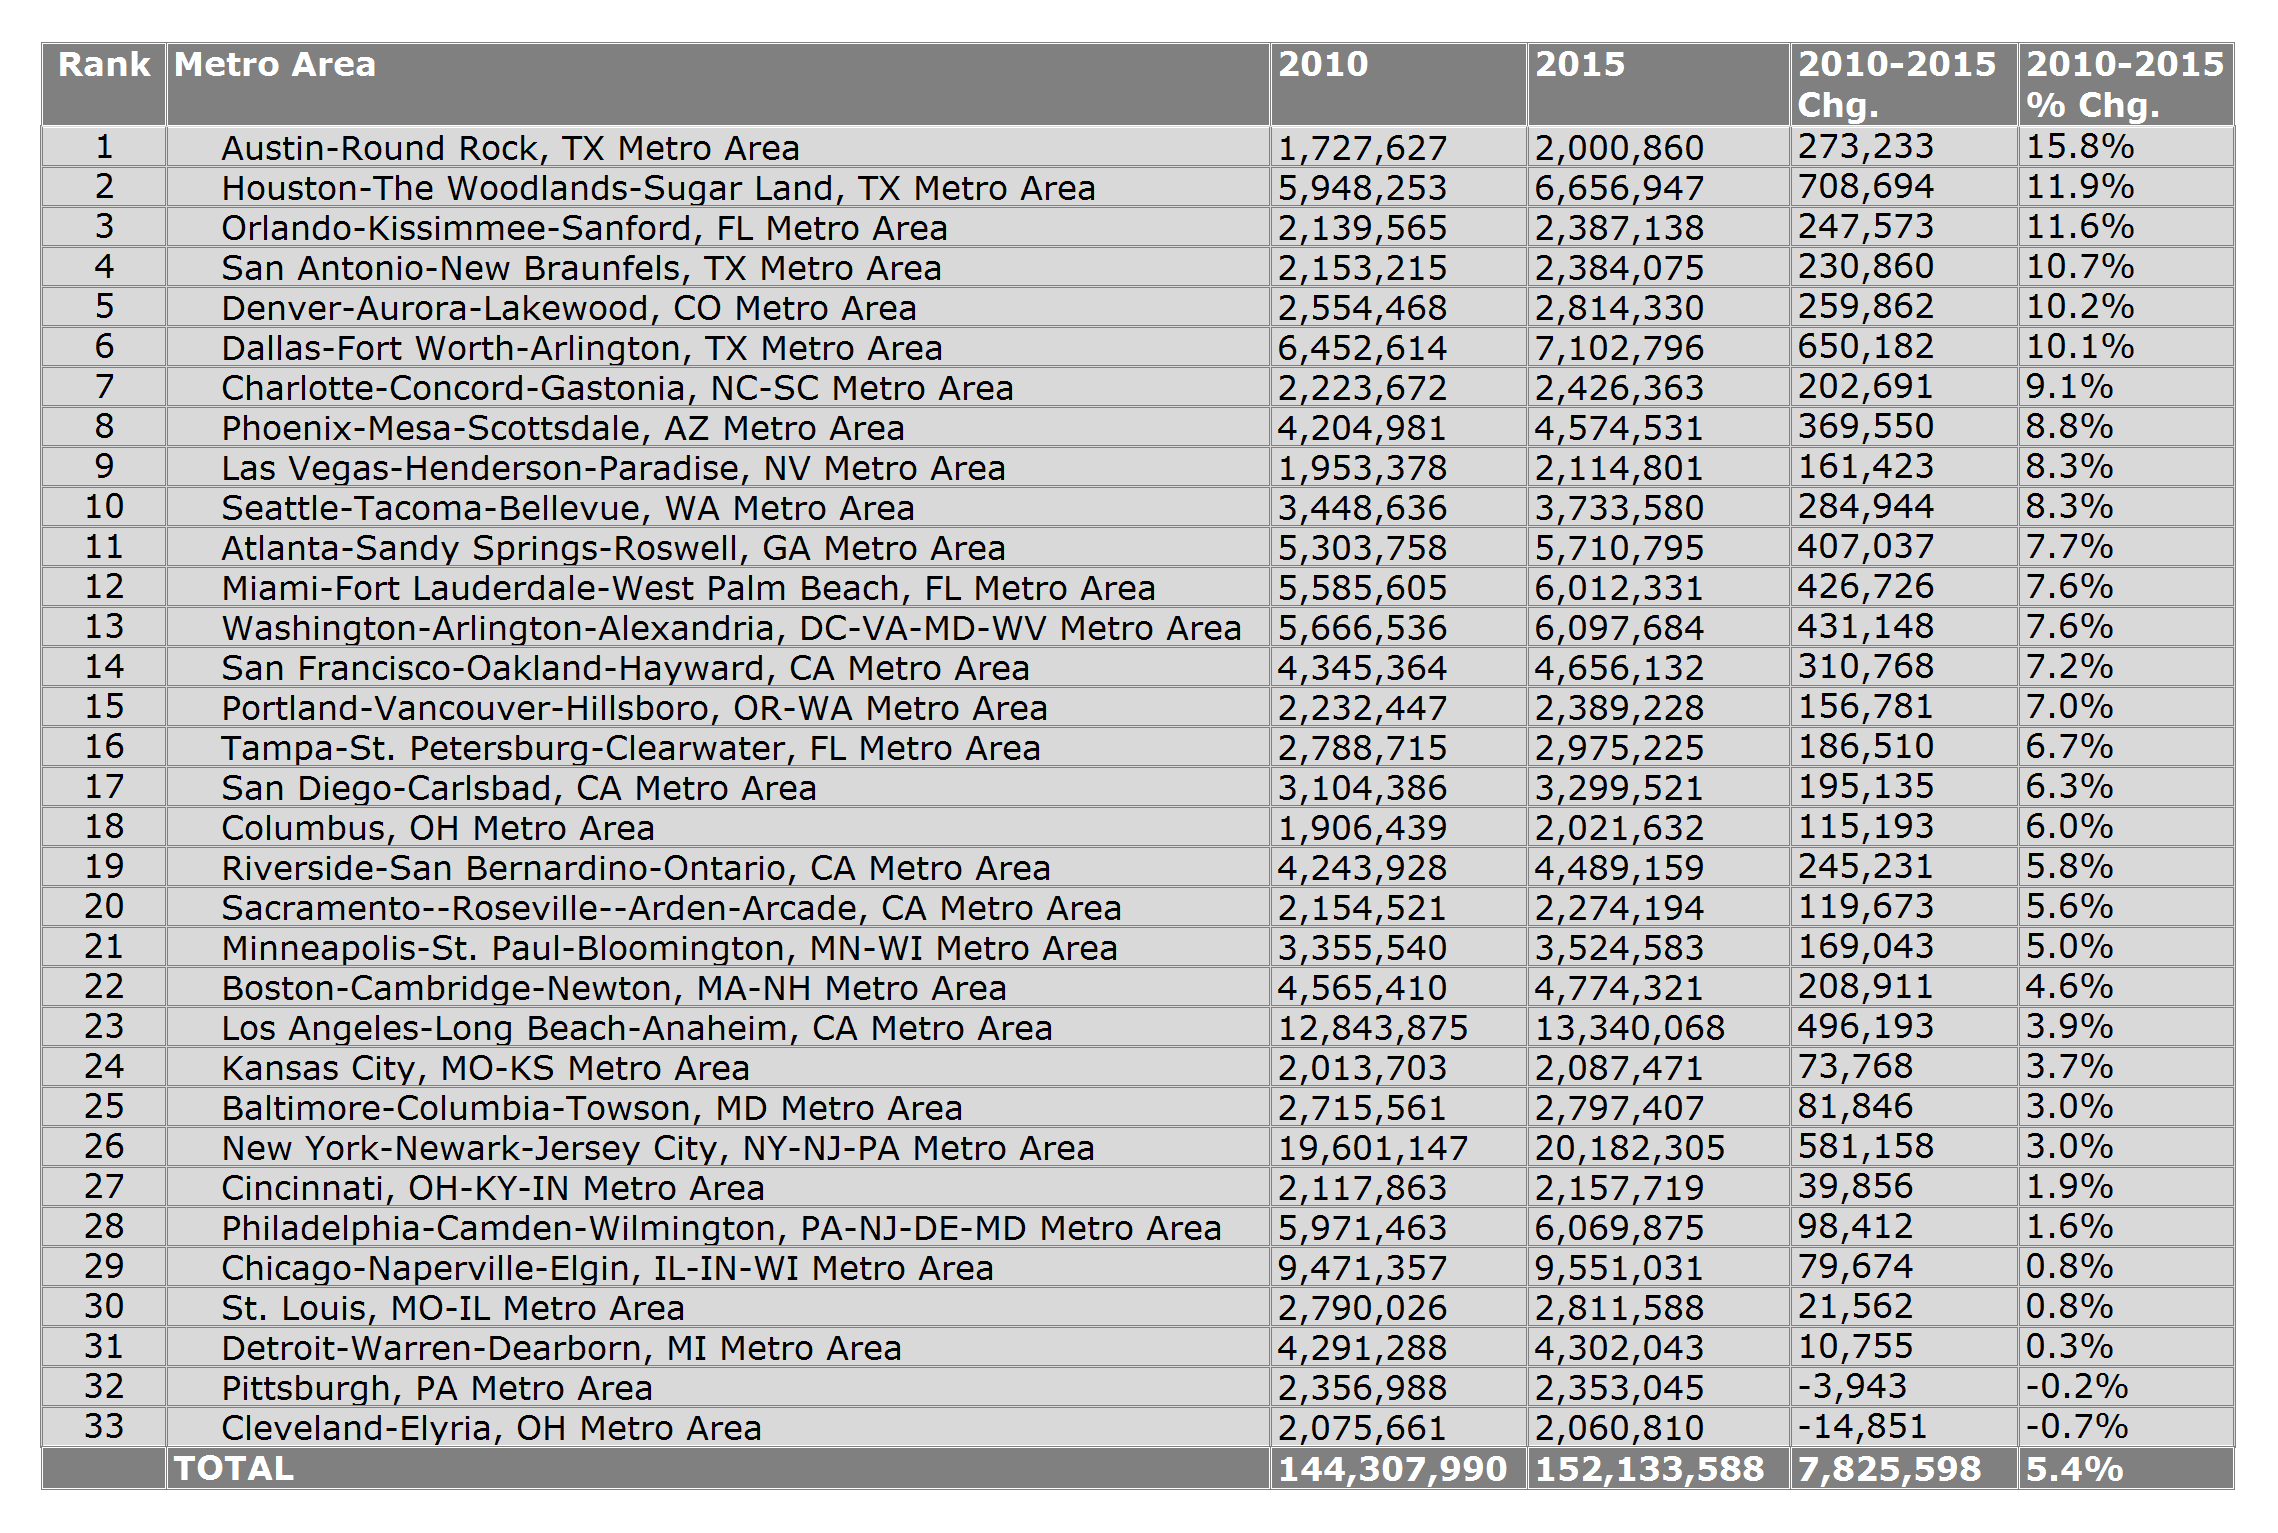
1. Large Metro Areas
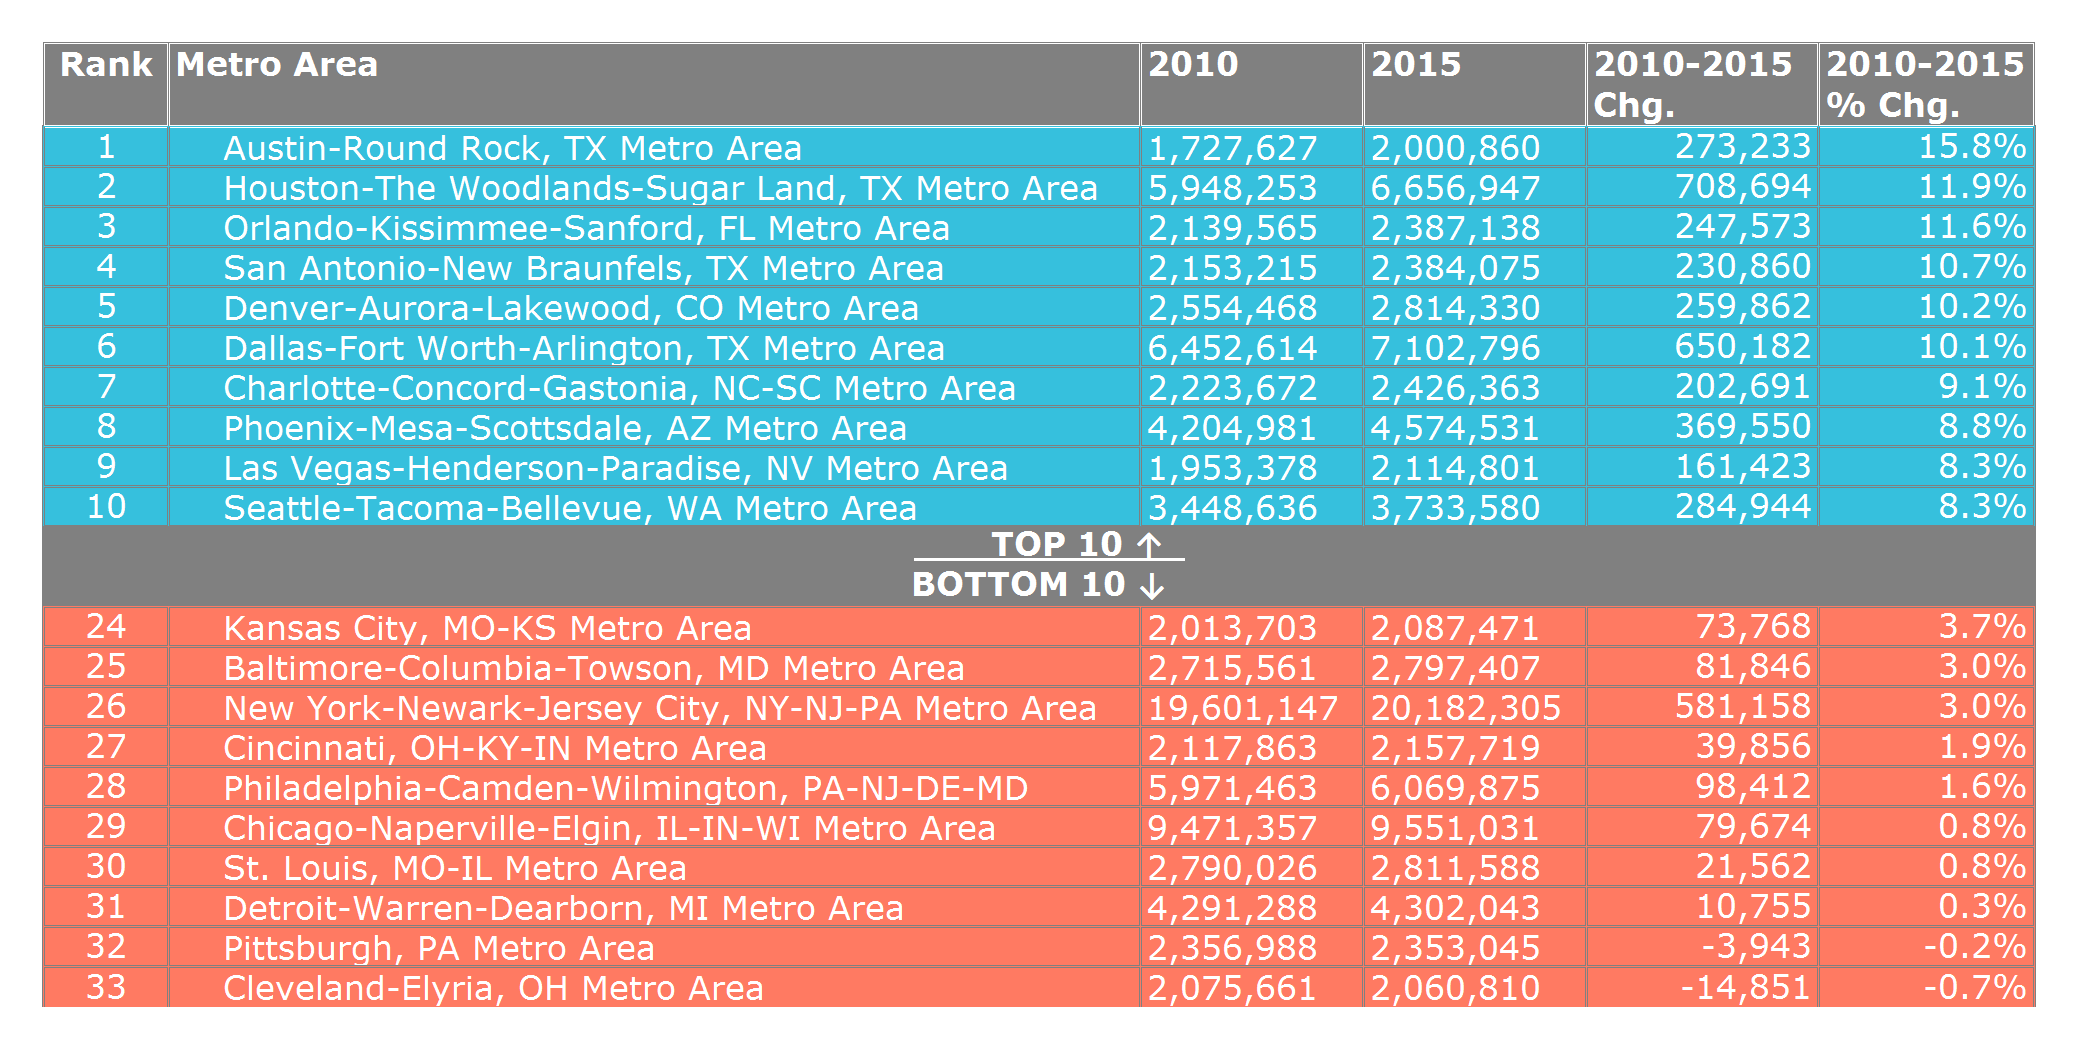
The regional growth contrasts are stark. Of the 10 fastest growing large metro areas, all of them are in the South or the West. And of the 10 slowest growing large metro areas, all of them are in the Midwest and Northeast. Austin’s growth rate continues to far outpace its peers at more than 15%. The next tier of metro areas includes the other Texas growth centers of Houston (11.9%), San Antonio (10.7%), and Dallas-Fort Worth (10.1%).
Minneapolis-St. Paul (by far the coldest of this group) is not among the fastest growing metro areas, but it is the only large region in the Midwest that is growing faster than the US average for all metro areas (5% compared with a 4.6% US average). And the Twin Cities are, to the potential surprise of many, growing at a significantly faster pace than Los Angeles (3.9%). Columbus, with its impressive 6% growth rate is growing even faster than MSP, and is the fastest-growing large metro in the Midwest. Pittsburgh, for all the talk of a city that has reinvented itself as a desirable destination after its dirty steel mill days, has actually lost residents since 2010, sharing that distinction with Cleveland as the only 2 large metro areas to have declined. Meanwhile, Detroit has managed to eke out a tiny 0.3% growth rate (10,000 net new residents).
Outliers: Minneapolis-St. Paul, MN; Columbus, OH; Los Angeles, CA.
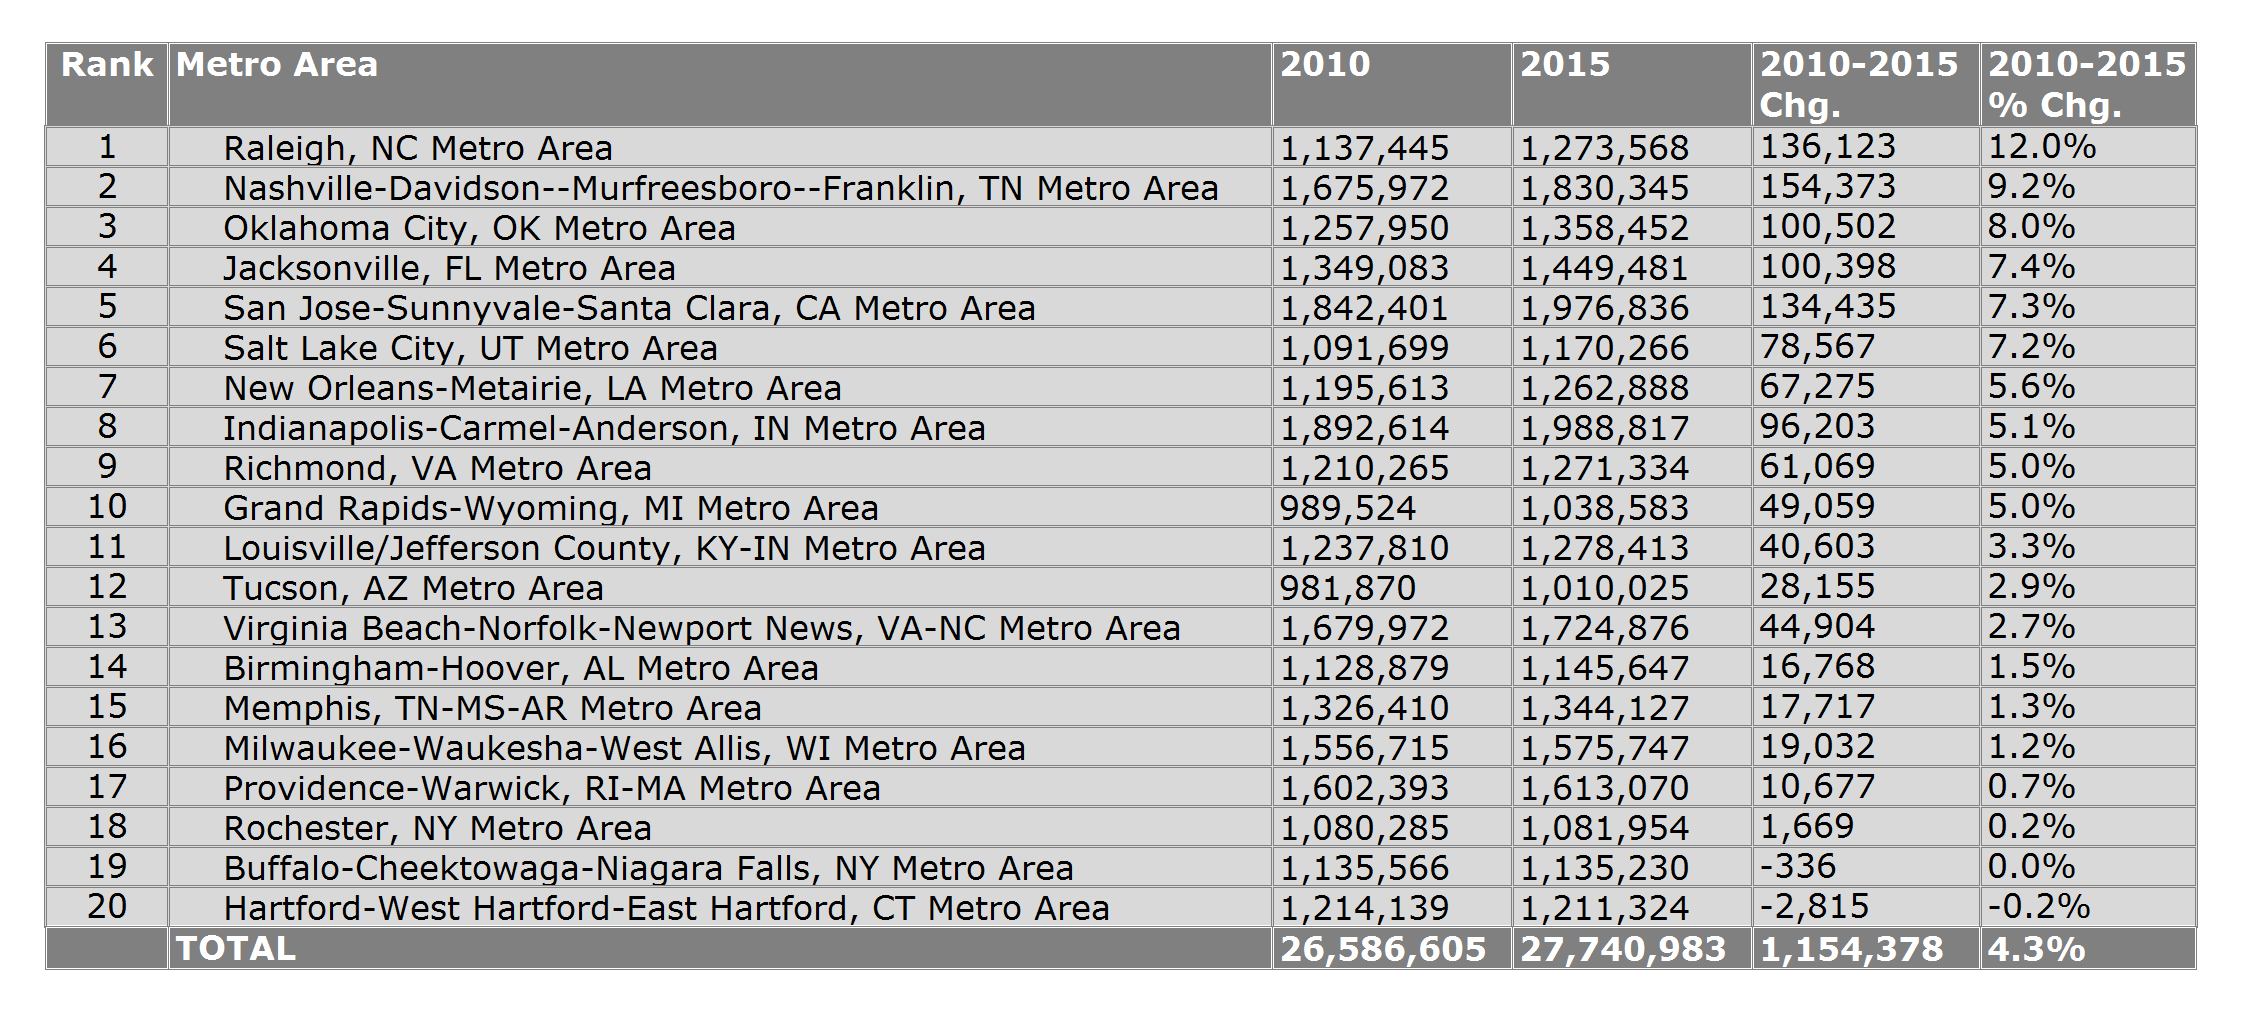
2. Mid-Size/Large Metro Areas
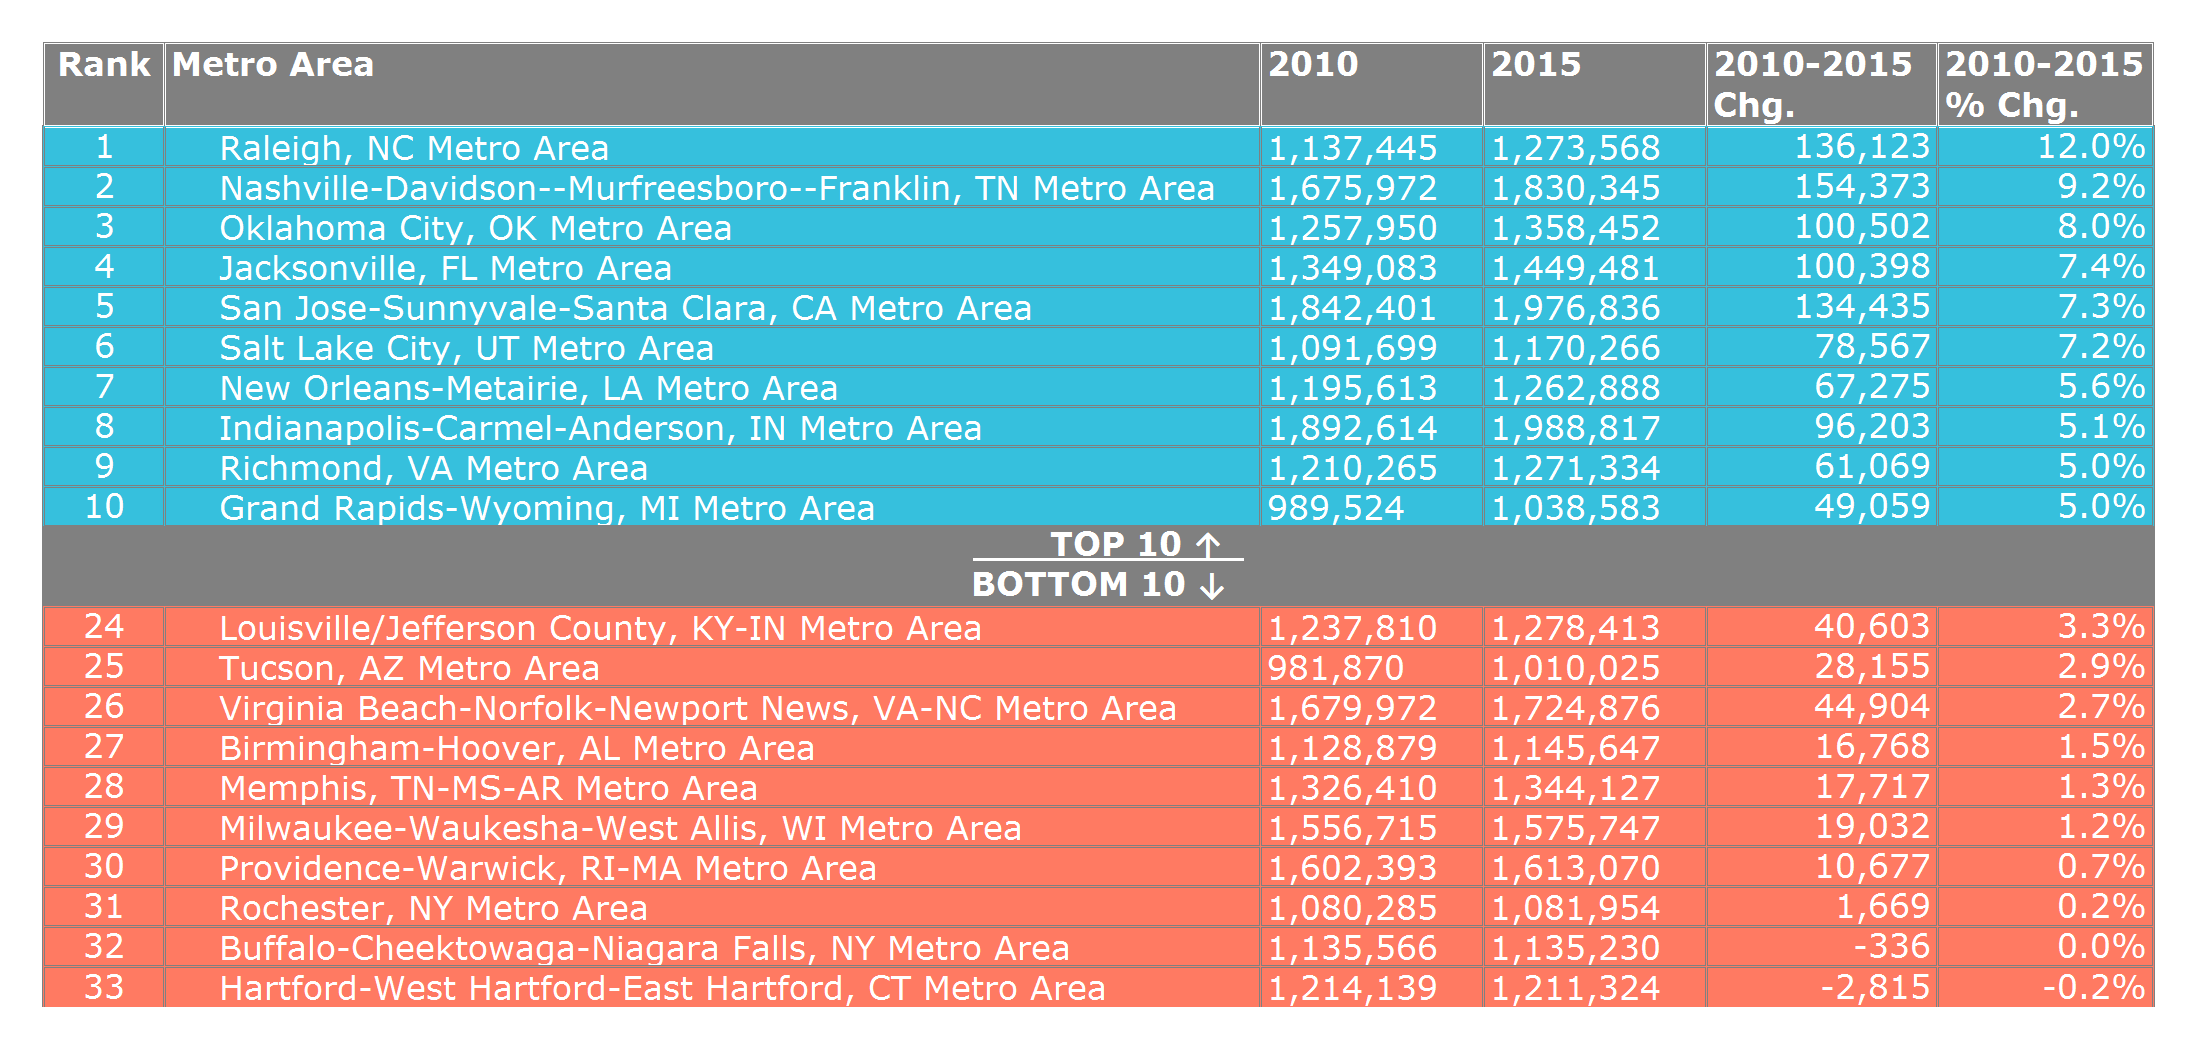
There is a bit more variation in regional performance among this group. The Sun Belt dominates the top of the list, with Raleigh far outpacing its peers with a 12% growth rate. But there are some growth centers in the Midwest. And some slow-growth metro areas in the South. Nashville’s growth rate of 9.2% is nearly 10 times its cross-state rival (Memphis). Grand Rapids is a bright star in Michigan with its 5% growth rate. Tuscon’s growth is a disappointing 2.9%, compared to its larger in-state neighbor (Phoenix), which is growing three times faster.
Most of the low-growth and no-growth regions are in the Midwest and Northeast, with the bottom five including Hartford, CT (-0.2%); Buffalo, NY (0%); Rochester, NY (0.2%); Providence, RI (0.7%); and Milwaukee, WI (1.2%). But two Southern metro areas, Memphis, TN (1.3%) and Birmingham, AL (1.5%) also fit into the low-growth category.
Outliers: Grand Rapids, MI; Tucson, AZ; Memphis, TN
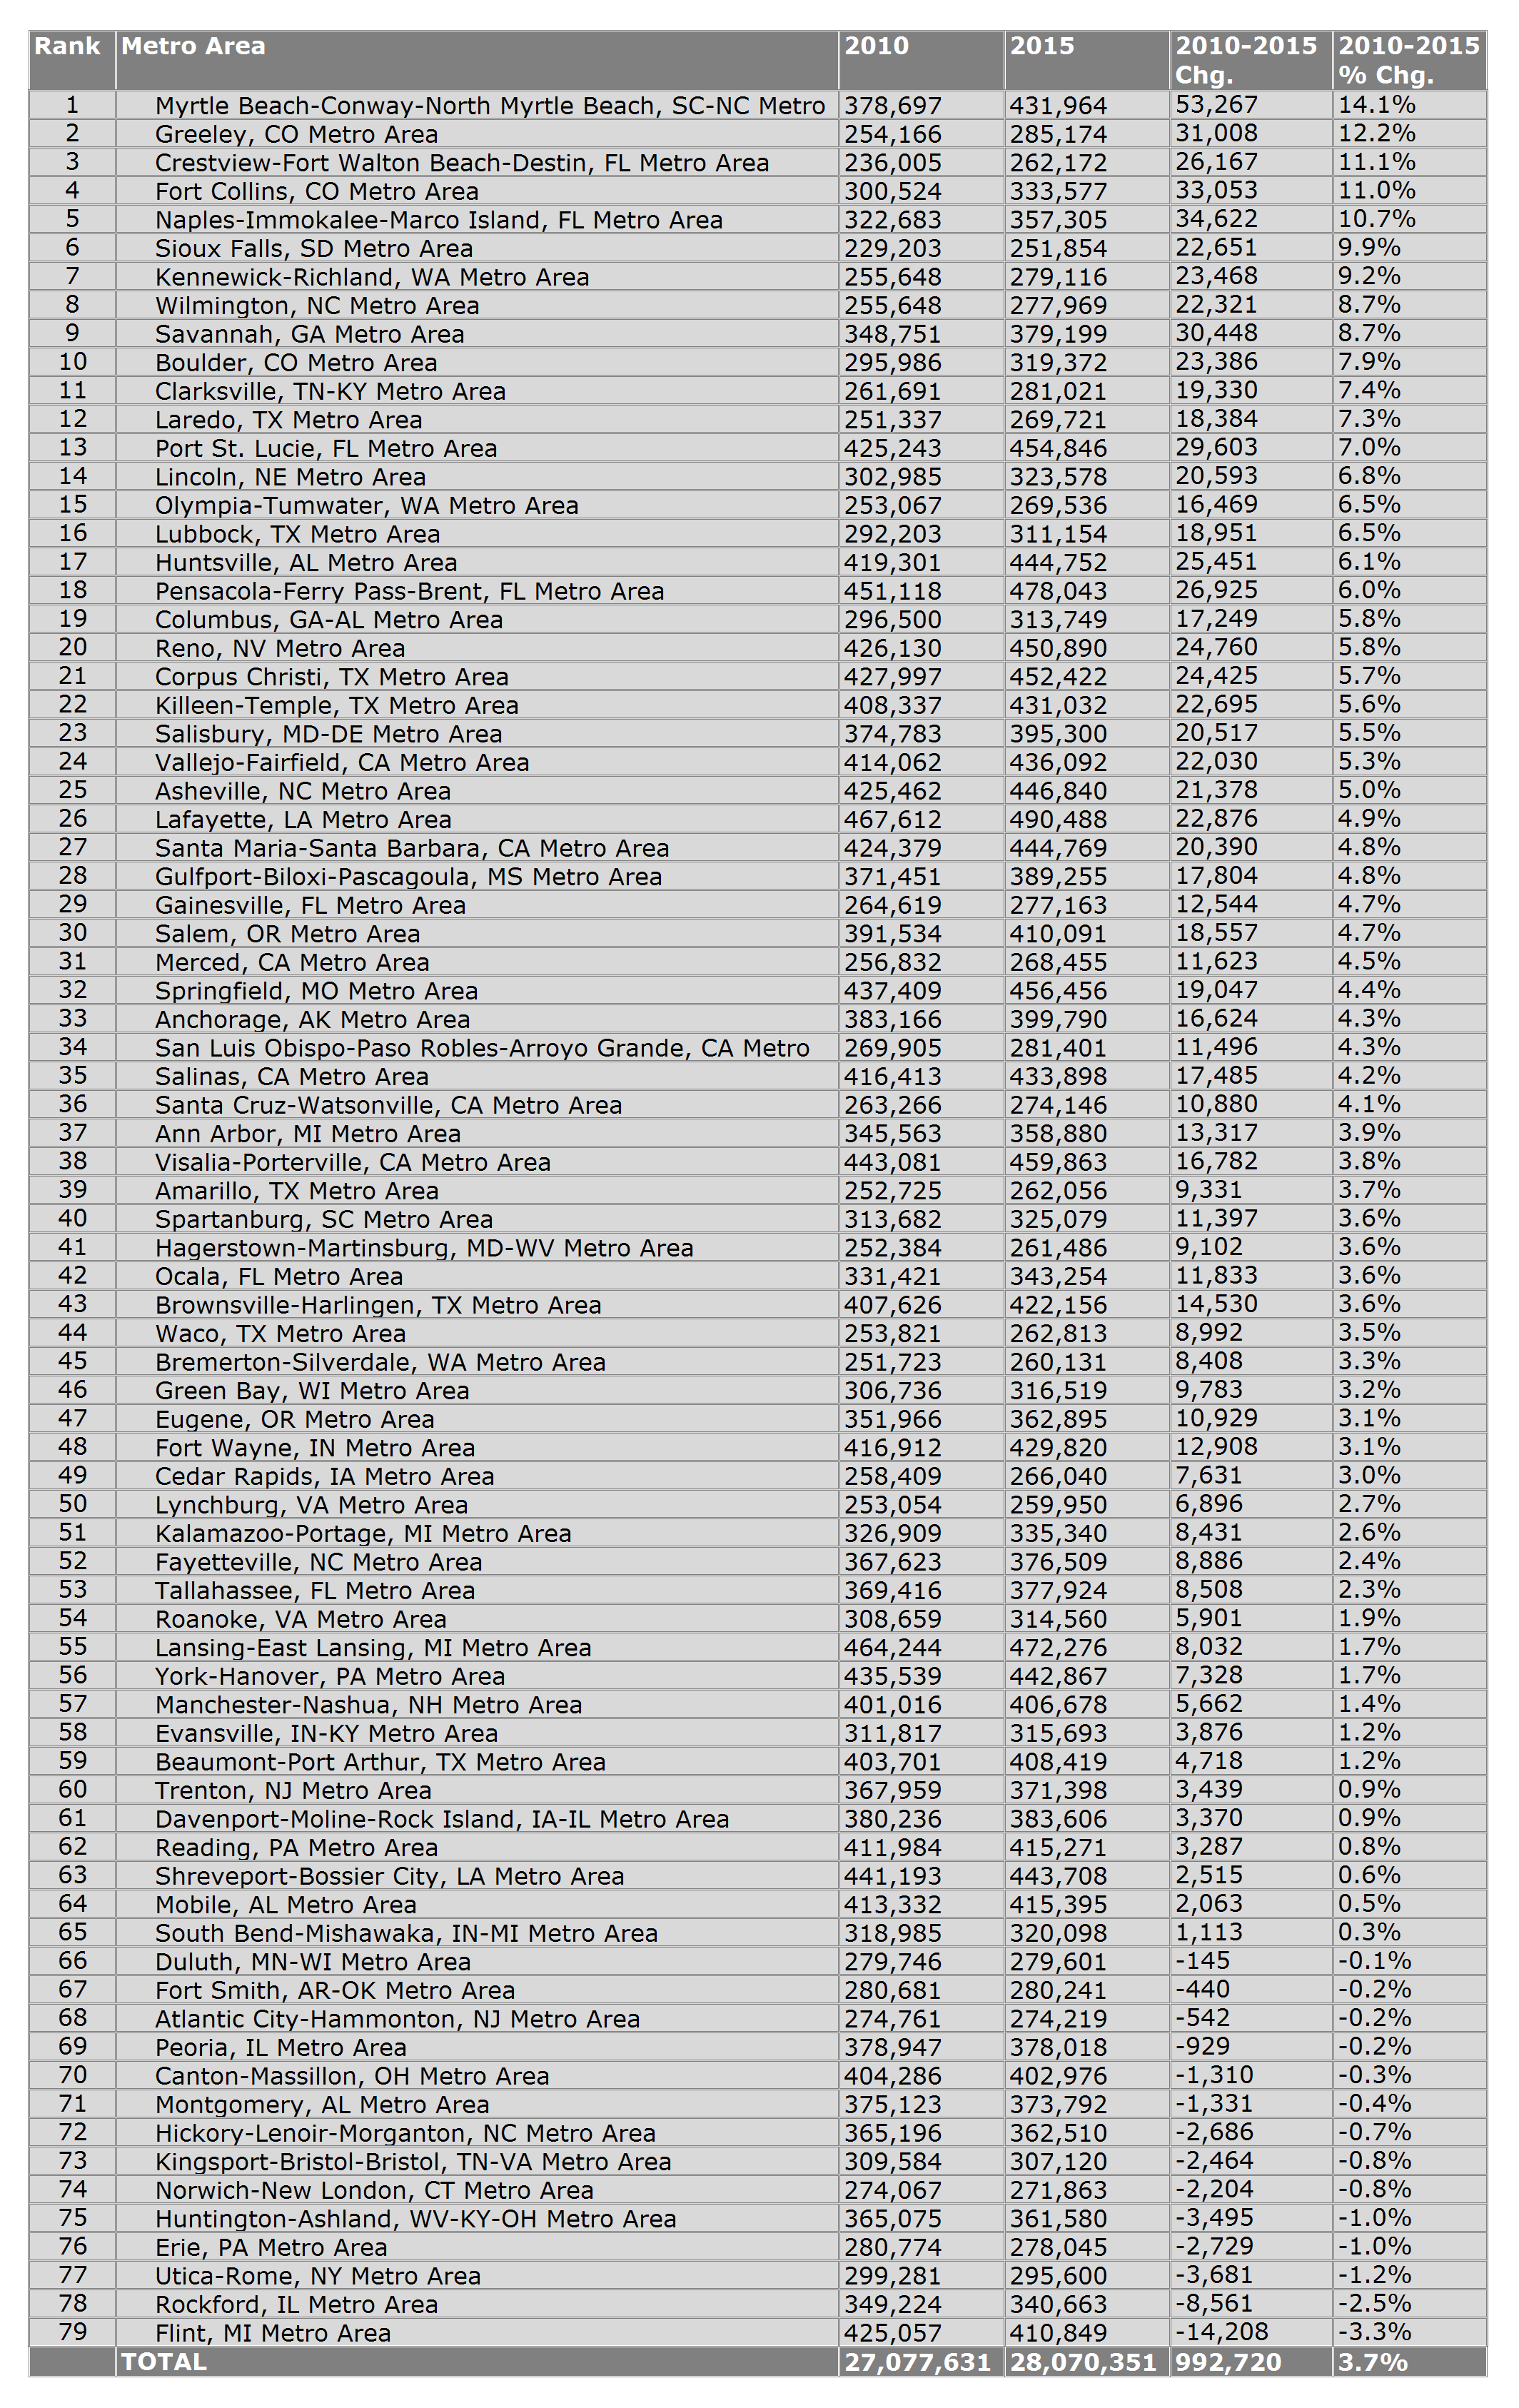
3. Mid-Size Metro Areas
Mid-size metro areas mirror national growth trends perhaps better than any other group. All 10 of the slowest-growing metro areas are in the Midwest and Northeast, with the 5 at the bottom all experiencing declines in their population since 2010. And 9 of the 10 fastest-growing metro areas are in the South and West, with the exception of Des Moines, IA with its 8.9% growth rate.
Madison, WI (5.7%) is another Midwest outlier, growing significantly faster than the US average and growing faster than almost every other Midwest peer. On the slow-growth side, Albuquerque, NM (2%) is an outlier, with minimal growth compared to its peers in the Western US.
Outliers: Des Moines, IA; Madison, WI; Albuquerque, NM
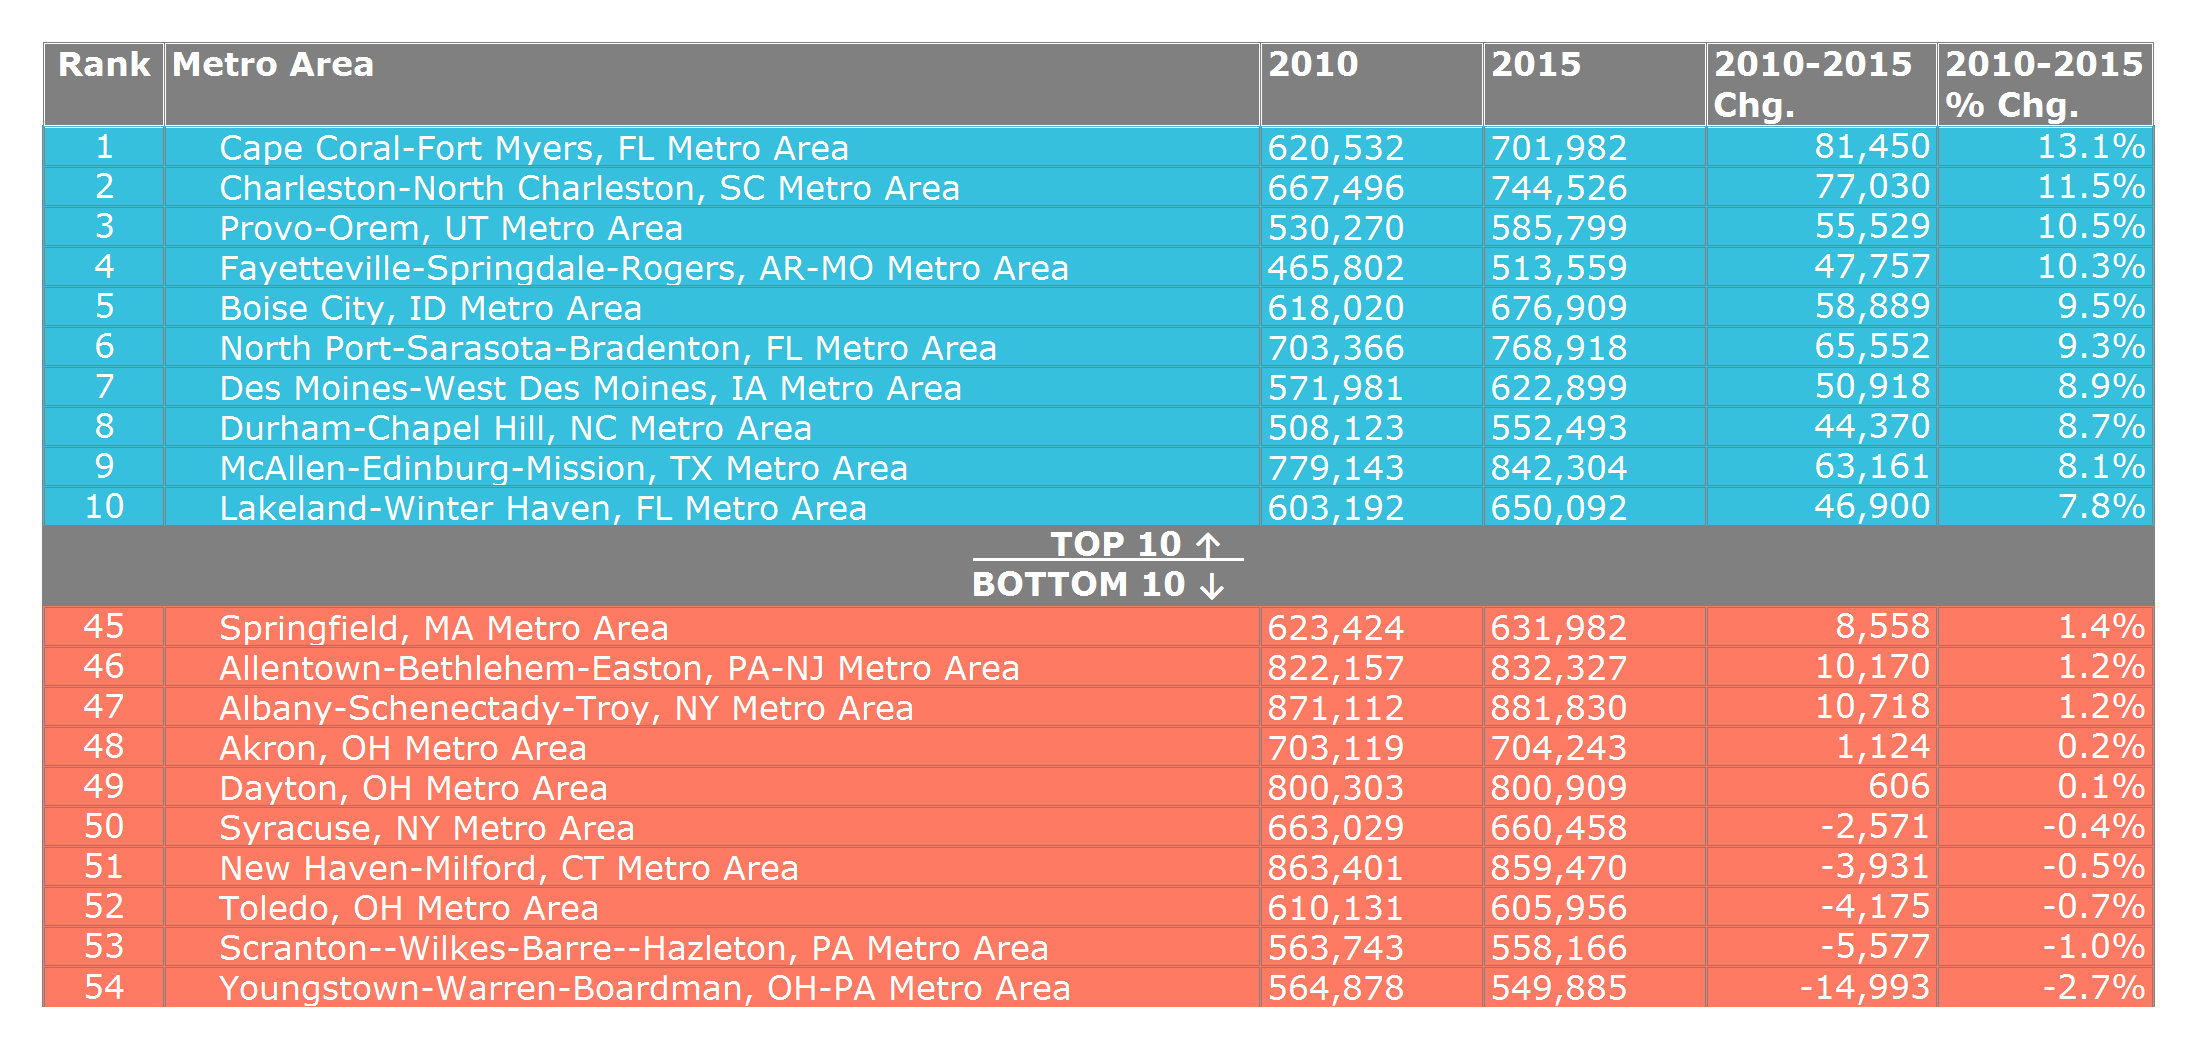
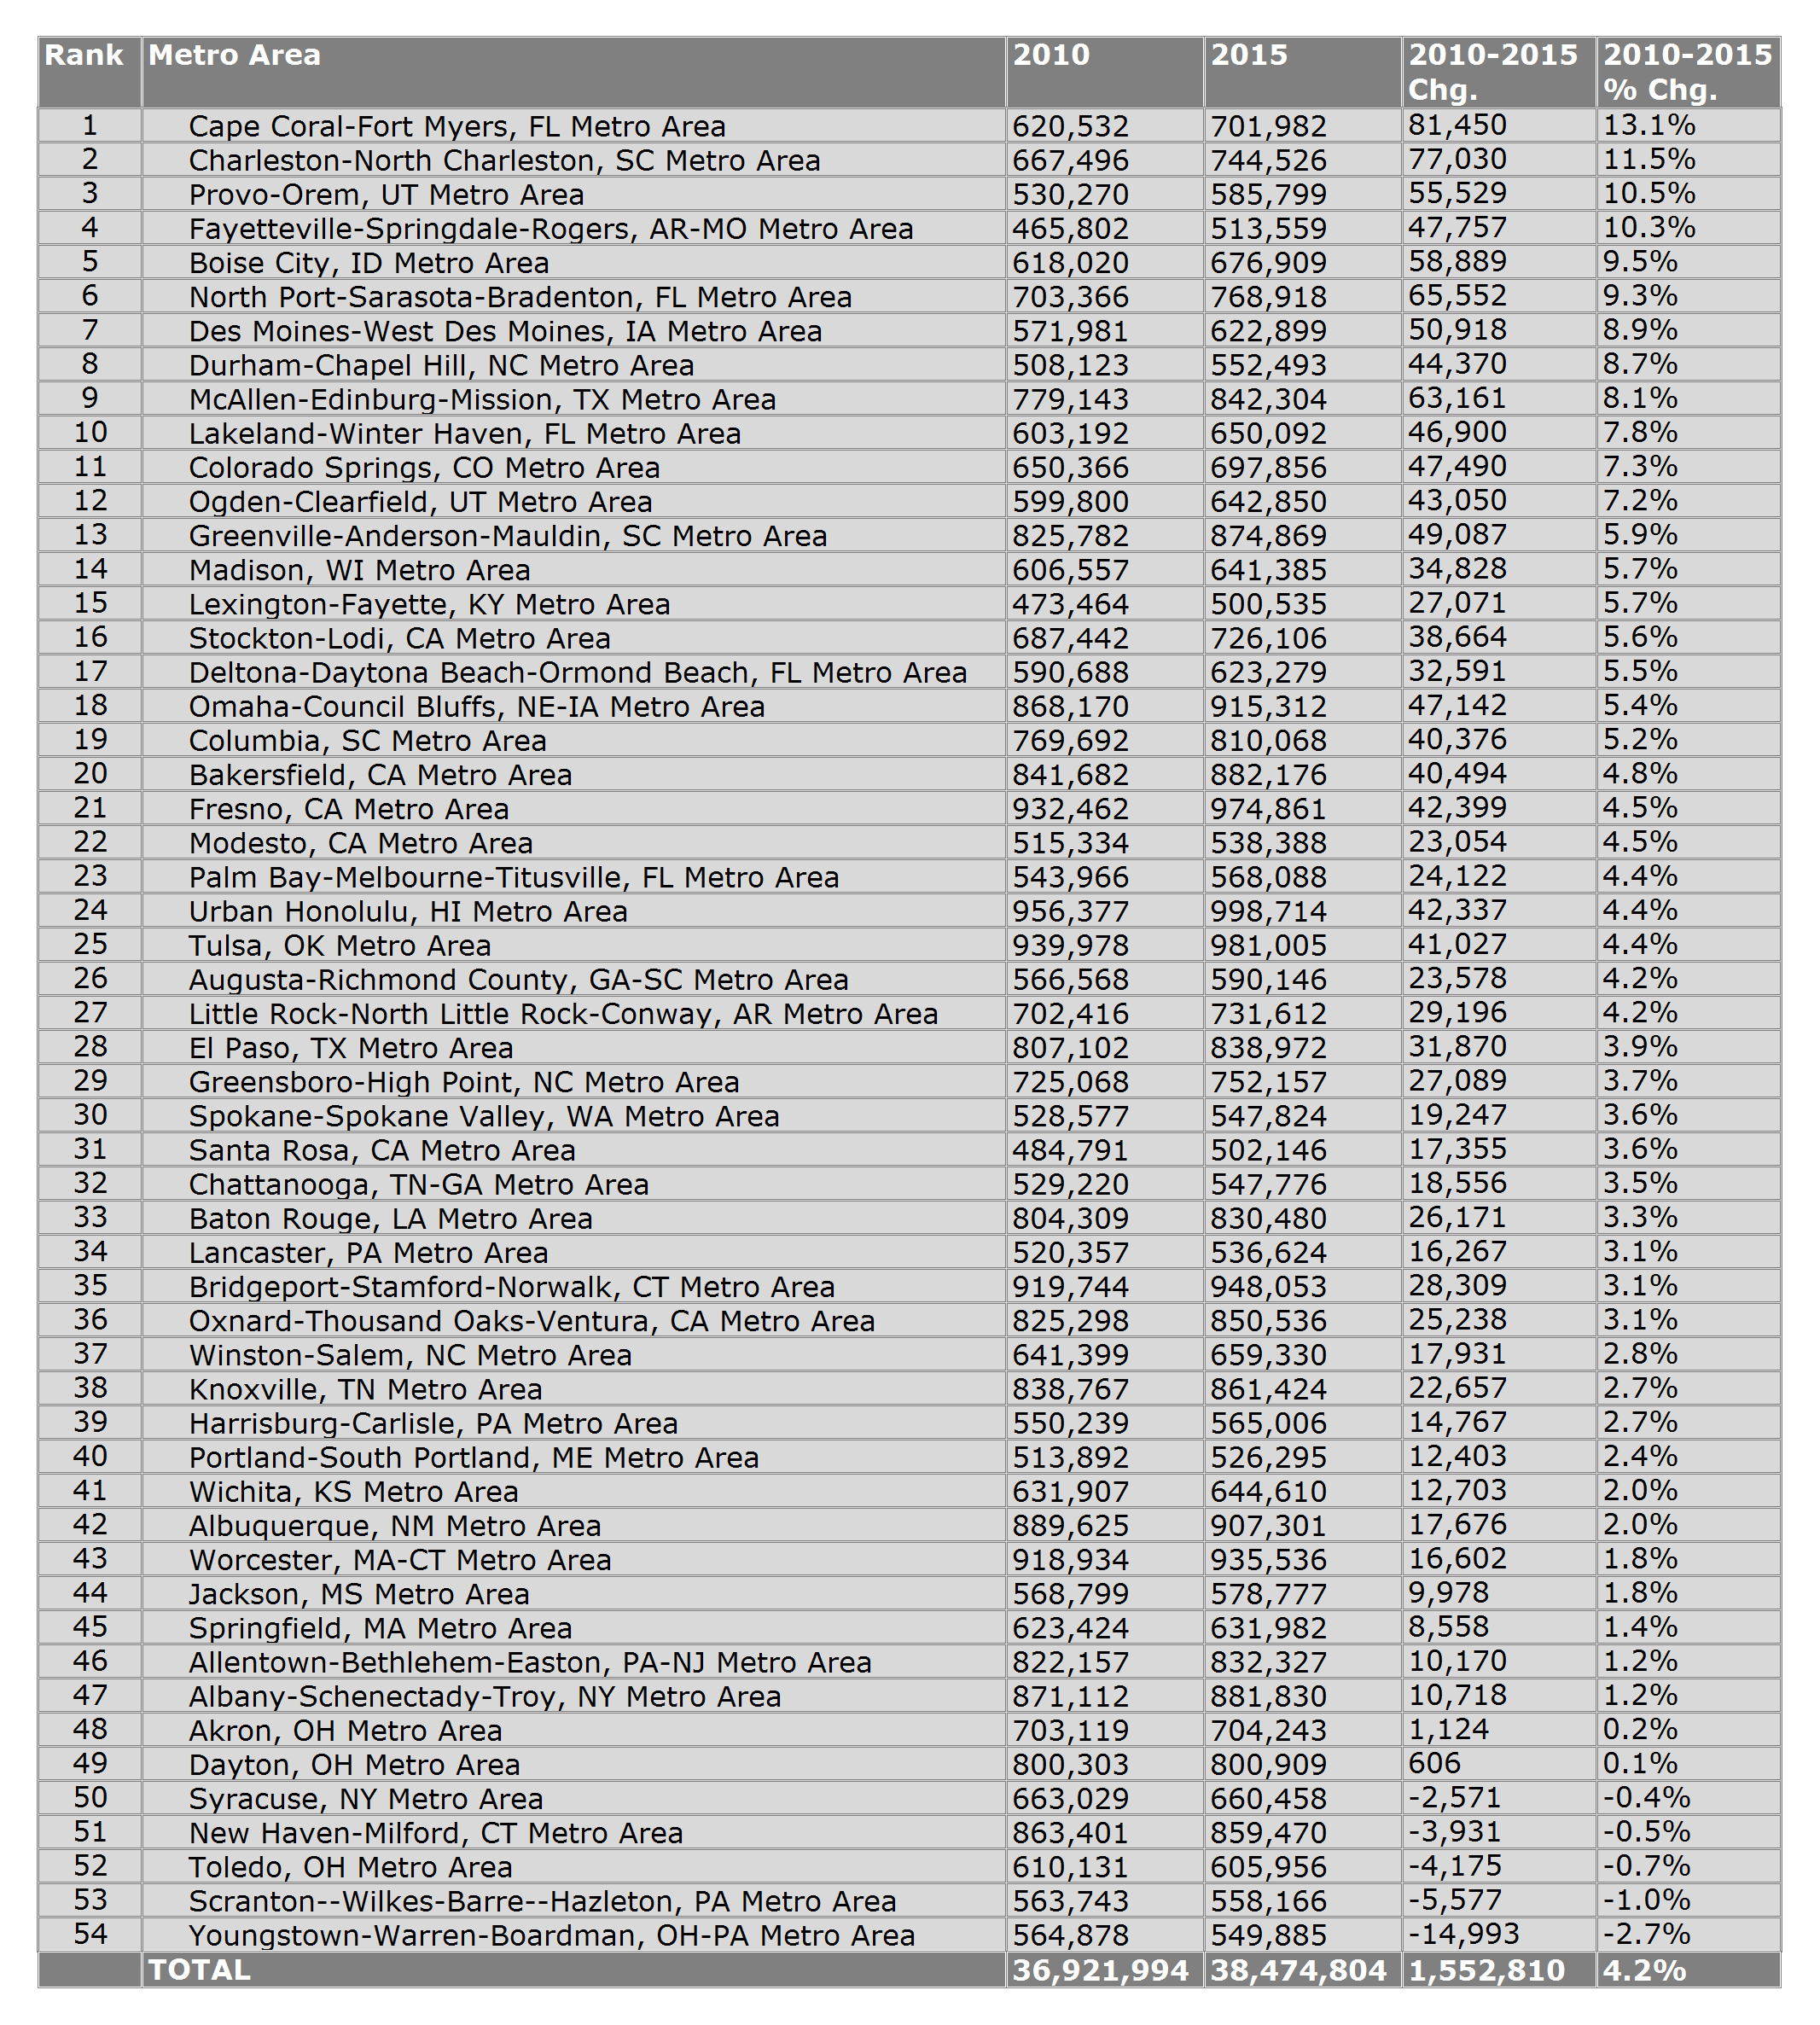
4. Small/Mid-Size Metro Areas

The norther tier of the Front Range in Colorado is a high-growth corridor, with Greeley (12.2%), Fort Collins (11%), and Boulder (7.9%) all in the top 10. Coastal communities in the Southeastern US accounted for half of the top 10: Myrtle Beach, SC/NC (14.1%); Crestview, FL (11.1%); Naples, FL (10.7%); Wilmington, NC (8.7%); and Savannah, GA (8.7%). A few other metro areas that you might not expect to see with such high growth rates include: Sioux Falls, SD (9.9%); Lincoln, NE (6.8%); and Lubbock, TX (6.5%).
The bottom of the list contains a mix of Midwest & Northeast metro areas and a smaller, but significant, amount of Southern metro areas. It’s not surprising to see population declines in old manufacturing communities like Flint, MI (-3.3%) or Rockford, IL (-2.5%), or Erie, PA (-1%). But it’s a bit more striking to see Southern communities like Montgomery, AL (-0.4%) or Fort Smith, AR (-0.2%) losing residents as well. Two other metro areas that you might not expect to see with growth rates well below the US average of 4.6% are Eugene, OR (3.1%) and Tallahassee, FL (2.3%).
Outliers: Sioux Falls, SD; Lincoln, NE; Lubbock, TX; Eugene, OR; Tallahassee, FL
5. Small Metro Areas
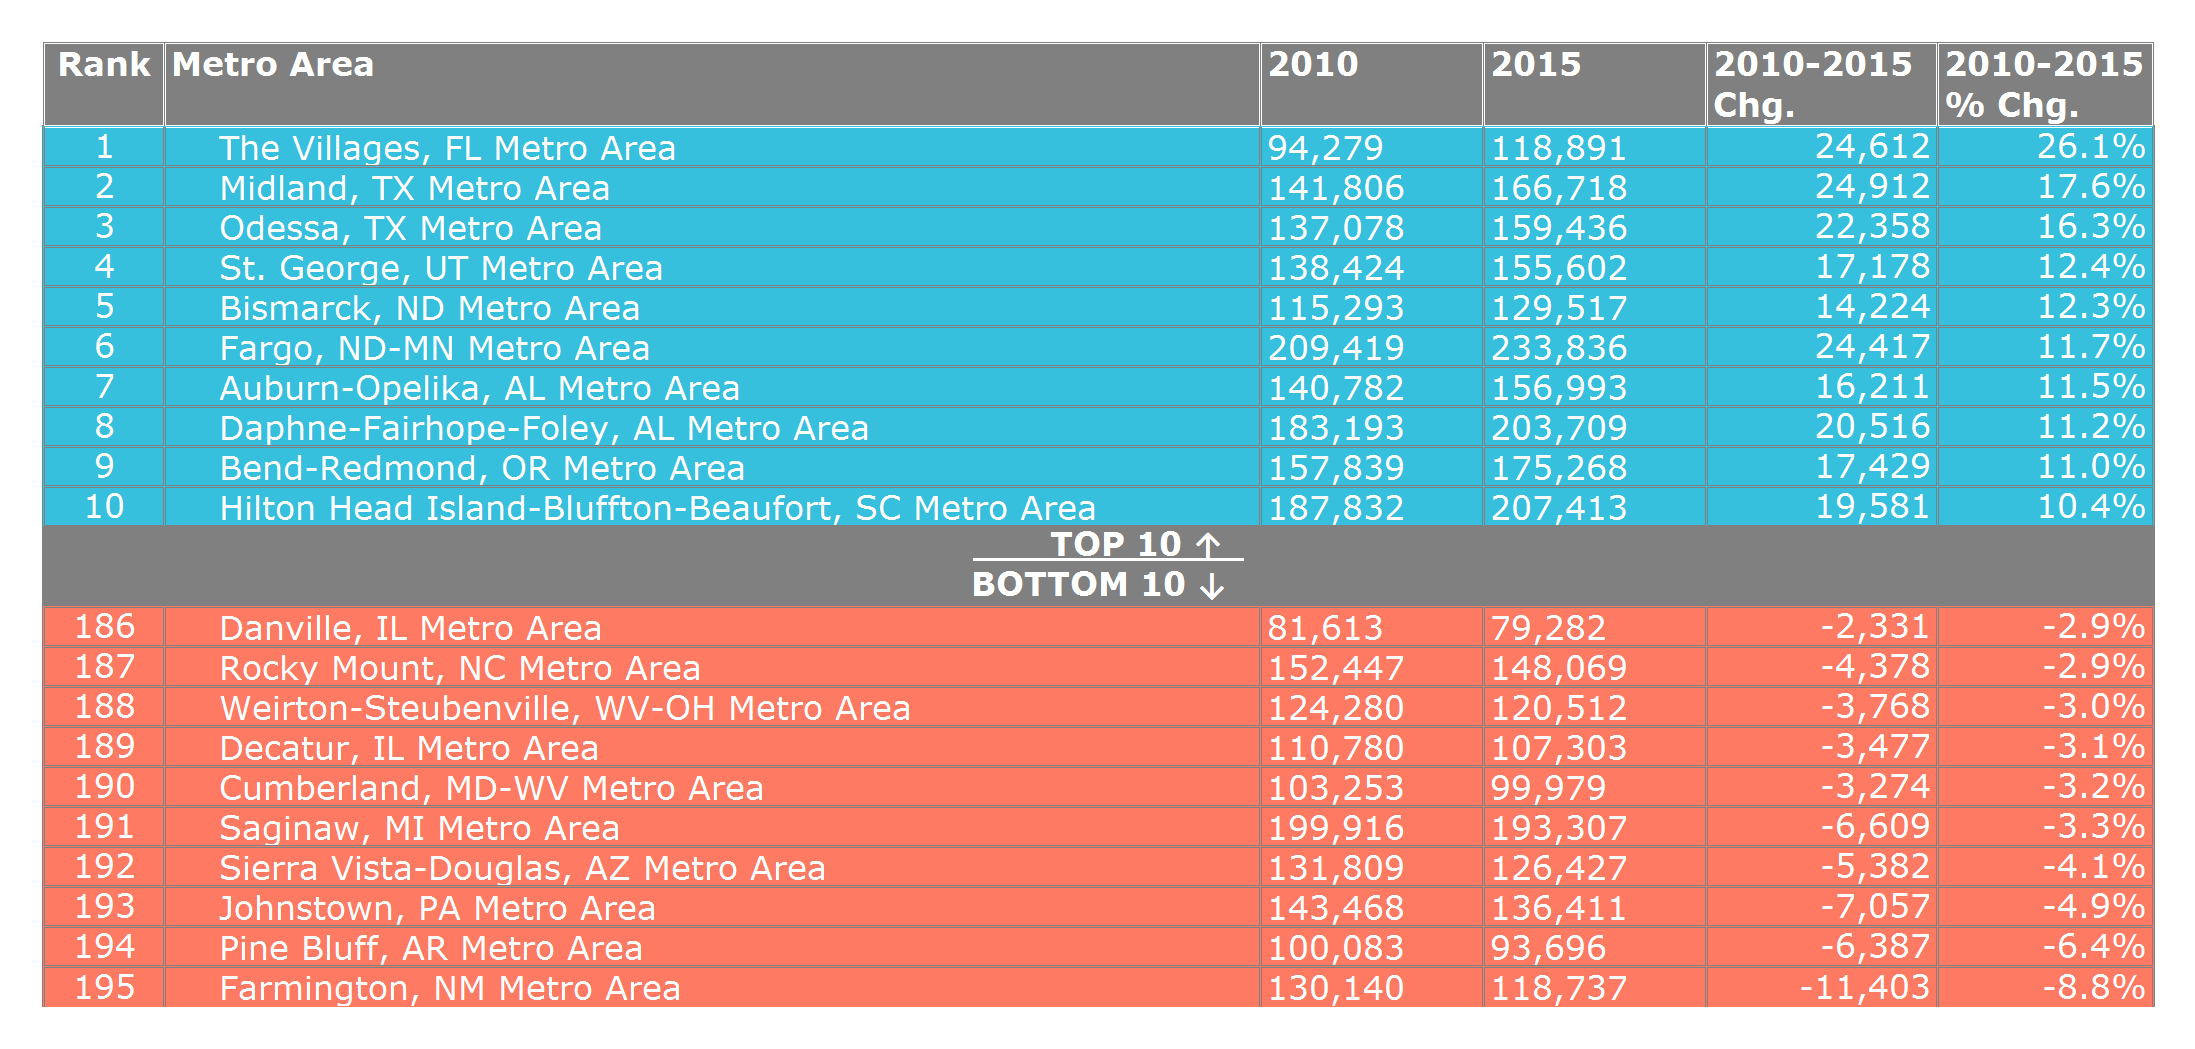
The fastest growing small metro areas are spread out all over the US. This group includes coastal communities like The Villages, FL (26.1%), Daphne, AL (11.2%) and Hilton Head Island, SC (10.4%); and oil boomtowns like Midland (17.6%) and Odessa, TX (16.3%); and outdoor recreation meccas like Bend, OR (11%) and St. George, UT (12.4%). Plenty of college towns also show up near the top of this list: Auburn, AL (11.5%); College Station, TX (8.6%); Iowa City, IA (8.8%); and Columbia, MO (7.2%).
But you might be surprised to see Fargo, ND’s 11.7% growth rate, making it the 12th fastest growing among all 382 metro areas. And you may also be shocked to hear that the 2 metro areas losing residents at the most rapid pace are not in the Midwest or Northeast. Pine Bluff, AR with its -6.4% growth rate and Farmington, NM with its -8.8% rate are in last place among all 382 metro areas.
Outliers: Fargo, ND; Pine Bluff, AR; Farmington, NM
Below are tables with growth comparisons for all 382 metro areas, broken down into their 5 size categories.
1. Large Metro Areas
2. Mid-Size/Large Metro Areas
3. Mid-Size Metro Areas
4. Small/Mid-Size Metro Areas
5. Small Metro Areas
Did anything in this blog post surprise you? I’d love to hear your feedback in the comments below. Maybe a future blog will explore some of these outliers a bit more to understand the issues affecting these metro areas’ growth or lack of growth…
John Karras believes that all communities have the potential to become more vibrant. John’s professional passions are aligned at the three-way intersection of urban planning, economic development and transportation policy. John founded urbanSCALE.com to empower urban planning and economic development professionals with the knowledge and tools needed to make their communities more vibrant. John is also the creator of the urbanSCALE Rating System, the first comprehensive measure of how urban a city is on a scale of 1 to 10.


Nice summary. It would be interesting to see how population density has changed over this same time period. I am from Omaha and we routinely annex suburban sprawl to claim population growth while other municipalities have fixed boundaries. Whatever gains are made by adding population we dilute with adding low density sprawl. I assume that some of these areas have increased density and population.
Jed- Thank you for your insights. Yes, a comparison of population density changes since 2010 would be potentially fascinating. Yes, Omaha continues to grow at a steady clip, the MSA is on track to surpass the 1 million mark sometime around 2020 or shortly thereafter…Hope you can direct more of that growth into the urban core.
Philadelphia Center City (downtown) is booming with tons of development. The flight has been in the peripheral, more suburban belts around the city. Notably, according to Pew, the largest number of migrants into Center City Philadelphia are from New York City.
Or maybe New York City was second and Pittsburgh was first, I can’t remember now. 😉
You bring up an important point, Paul. This data says nothing about the growth within MSAs. You’re right about downtown Philly. It’s a major growth magnet, and the regional trends disguise all of this. Even in much more depressed markets like Cleveland and Detroit, the downtowns are attracting lots of investment and growth.
And the migration patterns showing where people are moving to/from are also fascinating. Sounds like a potential future blog post!
This is exactly why gross population figures at the metro level, especially large and mid-size metros, are not a particularly valuable metric. Where and how is the growth in population taking place? What is the nature of that development? More or less efficient in terms if land use and transportation? There are many other factors that just are not accounted for that are the variables, many difficult to measure or compare, that are far more important to determining or assessing prosperity and progress.
What you note about Phili is also true about Chicago (so I’ve read), where there is respectable growth downtown and in multi-use nodes, but population decline in many post-1960s suburbs.
Piling on to my previous post(s), metro population does not provide great insight into State-level dynamics that are the result of State politics and conditions, changes in economic actors or clusters, or weather during that period (drought, flood, heat, disaster, etc.).
Take my home State of Wisconsin for example. The current political regime has been incredibly regressive, perhaps more so than any other state during the period (vying with Kansas for that dubious title). Levy caps on municipal governments and school districts, puts to K-12 and high ed institutions, reductions or elimination of non-automobile transportation funding, eroding environmental and consumer protections, arbitrary tax cuts and incentives to politically connected firms, reductions in low-income assistance programs of all types — and more — are dragging down economic growth, and actively and intentionally starving local governments ability to provide services and invest in public infrastructure. At the ground level, the impact is stark when reasonably well-planned communities can barely keep up with deferred maintenance much less invest in quality of life amenities that support growth and prosperity.
I am aware that other States are having some battles and/or have fought those battles in the past. However, when you look at how State policy impacts the character of local development, transportation, growth, prosperity, the State of Wisconsin has been as case study of how to crush prosperity – and it shows up in these population figures.
Your comment about Minneapolis being the only large metro in the Midwest to be growing above the average is incorrect. Columbus OH is in the large category and higher (6.0% vs 5.0%) than Minneapolis-St Paul over the past 5 years. This should be listed in the outlier category and the text updated to reflect this.
George- You’re absolutely right. Thank you for catching that! Columbus is very much an outlier in the Midwest, with steady growth that more closely resembles a Southern metro. I’ve updated the text to highlight this.