
This blog post is for all of the data geeks. And for anyone who’s ever wished for a single piece of data that accurately reflects a city’s quality of place.
There is one data point that does a better job of gauging the quality of place in any given city than anything I’ve come across. Want to know what it is? I’ll tell you. But first, let me tell you the story of how I came to this realization. (If you simply can’t wait, you can skip down to find the answer highlighted in bold. But if you can spare 5 minutes to read the primer, it’ll be worth it).
The internet is littered with hundreds of lists claiming to measure a city’s quality of life…and most of them are basically worthless. That’s because quality of life is so subjective and means completely different things to different people. For some folks, dense cities like New York are paradise. But for others New York is Hell-on-Earth (how do you think Hell’s Kitchen got its name?). Same goes for rural areas and small towns. Part of the problem is with the term “quality of life”. I prefer to use “quality of place” (and so does Richard Florida, and other leading urban thinkers). But the bigger problem is in the way quality of life is typically measured.
Case in point, I recently came across a rating for the Best & Worst Cities to Start a Career from WalletHub and was excited to find out that one of my current clients – Irving, TX – was rated as the number one city to “Start a Career” according to WalletHub. Great news for Irving! But a significant part of WalletHub’s rating is total nonsense. Irving is fully deserving of this accolade, but I take issue with part of WalletHub’s methodology.
Side note: I’m currently leading a project to create a new 5-year economic development strategic plan for the City of Irving. In fact, I’ll be there delivering some preliminary recommendations to the City Council later this week. Our firm is fortunate to be working on this project concurrently with the city’s comprehensive plan which is being lead by the stellar urban planning firm Fregonese Associates out of Portland, Oregon. We are working in close partnership with Fregonese, and I was lucky enough to meet and spend some time with John Fregonese a couple months ago in Irving…and he is one of the true stars in the urban planning profession.
Being the data geek that I am, my first instinct was to look at WalletHub’s methodology. The rating covers the 150 largest US cities. Not metro areas. Just individual cities. Just like the urbanSCALE Rating System. All good so far. And it uses 19 data points organized into 2 scales (for comparison, the urbanSCALE Rating System uses over 100 data points broken down into 10 scales). The two scales are “Professional Opportunities” and “Quality of Life”, with Professional Opportunities receiving double weight.
If you look at the “Professional Opportunities” scale, the data points make sense and all fit together nicely. They accurately tell the story of where you can find the best places to start your career or take the next step in your professional advancement. Here are WalletHub’s professional opportunities data points:
- Number of Entry-Level Jobs per 10,000 Inhabitants: Full Weight
- Monthly Median Starting Salary (adjusted for cost of living): Full Weight
- Annual Job Growth Rate (adjusted for population growth): Full Weight
- Median Income Growth Rate: Full Weight
- Economic Mobility: Full Weight
- Workforce Diversity: Full Weight
- Unemployment Rate: Full Weight
- WalletHub “Entrepreneurial Activity” Ranking: Full Weight
This provides solid evidence that Irving is a great place to advance your career (and so is Grand Prairie, TX ranked #2 and Houston, TX ranked #3). And it also makes sense that Detroit, MI is not the best place for career advancement with a rank of #145 (nor Toledo, OH ranked #144, nor Milwaukee, WI ranked #147).
The “quality of life” scale, on the other hand, has some serious issues. Here are WalletHub’s quality of life data points:
- Median Annual Income (adjusted for cost of living): Full Weight
- Number of Arts, Leisure & Recreation Establishments per 100,000 Inhabitants: Full Weight
- Percentage of the Population Aged 25 to 34: Full Weight
- Strength of Social Ties: Full Weight
- Percentage of the Population with a Bachelor’s Degree or Higher: Full Weight
- Population Growth (2042 vs. 2012): Full Weight
- Housing Affordability (median annual family income divided by housing costs): Full Weight
- WalletHub “Recreation” Ranking: Full Weight
- WalletHub “Families” Ranking: Full Weight
- WalletHub “Single People” Ranking: Full Weight
- WalletHub “Weather” Ranking: Half Weight
The biggest problem with this ranking (and most quality of life rankings) is the inclusion of housing affordability, which introduces a contradictory element into this set of data points. If a city is much more expensive than the US average, that’s a strong sign the city is a desirable place, because people are willing to pay a premium to live there. When you include conflicting data points like housing affordability in a quality of life measurement, you get screwy results.
In WalletHub’s case, Lubbock, TX (ranked #66 out of 150 for quality of life) is shown as having roughly the same quality of life as Boston, MA (ranked #67). At the same time, New York ranks #120 in quality of life. And Honolulu ranks #107. Really, WalletHub? You’re going to stand behind a ranking that shows the quality of life in Honolulu is significantly worse than the quality of life in Lubbock? With all due respect to Lubbock (which is my hometown and has some great things going for it, like Texas Tech University), that is absolutely crazy!
All of this leads us back to the title of this blog post. So, what exactly is this “holy grail” data point that is a near-perfect proxy for quality of place? Answer: The percentage of people who work from home.
Yes, it’s that simple. In the US as a whole, 4.3% of employed people work primarily from home. This means that 95.7% of the working population has a job that is tied to a physical location. The remaining 4.3% can live just about anywhere, because their jobs are not tied to a single location. It turns out that these people who can work and live anywhere are the magic piece of data that tells us which places are more desirable and which places are less desirable.
If a significantly higher percentage of people than the US average are working from home in a given city or metro area, that community has a high quality of place. And if a relatively low percentage of people are working from home in a given city or metro area, that community is lacking in quality of place.
To prove the point, I’ll let the data speak for itself. Below are the top 10 and bottom 10 metro areas (among the 100 largest metro areas ranked by the number of workers age 16 years and older), ranked by percent of people working from home. You can see the table for all 100 of the largest metro areas farther down (and a table with all 381 metro areas at the end of the page).
I’m prepared for the reality that this will offend some people. But I think most of you will agree that the high-ranking places are widely known for their quality of place, and that the low-ranking places are not. Please weigh in at the bottom of the page in the comment section if you disagree, or if you agree.
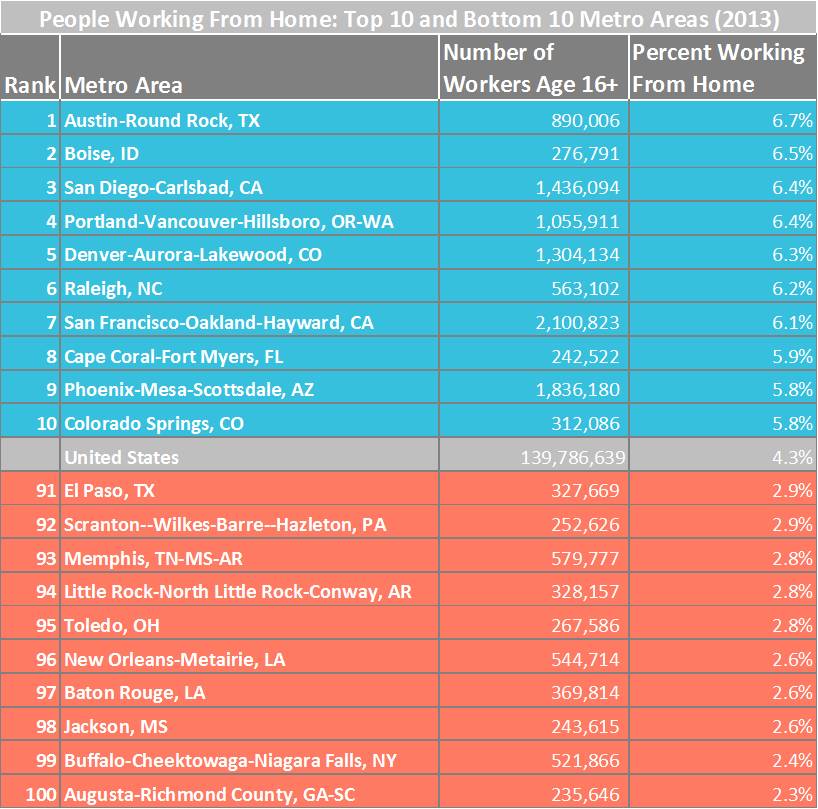
Source: US Census Bureau, American Community Survey 5-Year Estimates (2013).
New Orleans is perhaps the one place that stands out in the bottom 10 that doesn’t entirely seem to fit. But it’s a special case, given the unique economic challenges it has dealt with in the aftermath of Hurricane Katrina. But even here, the rule seems to hold true when you dive deeper into the data. The City of New Orleans has a significantly higher percentage of people who work from home (3.5%) than the metro area as a whole (2.6%).
Side note #2: It’s a funny coincidence that I’m actually in New Orleans right now for the first time, as part of a consulting engagement. The project is to create a Regional Development Plan for the Delta Regional Authority, a one-of-a-kind federal agency that covers a 252 county/parish area in portions of 8 states in the Deep South, mostly in the Mississippi Delta region. We’re conducting stakeholder input sessions in 10 different locations as part of the project, one of which is near New Orleans. Fascinating project and fascinating city.
On the positive side, the places in the top 10 list (Austin, San Diego, Portland, Denver, San Francisco, etc.) are hard to argue with as some of the premier US cities with a strong sense of place. Interestingly, none of these places is cheap, which fits with our earlier statement that desirable places tend to be more expensive. And they all rank highly on the urbanSCALE Rating System. Anybody disagree with these?
Here is the complete list of the 100 largest metro areas ranked by the percentage of people working from home:
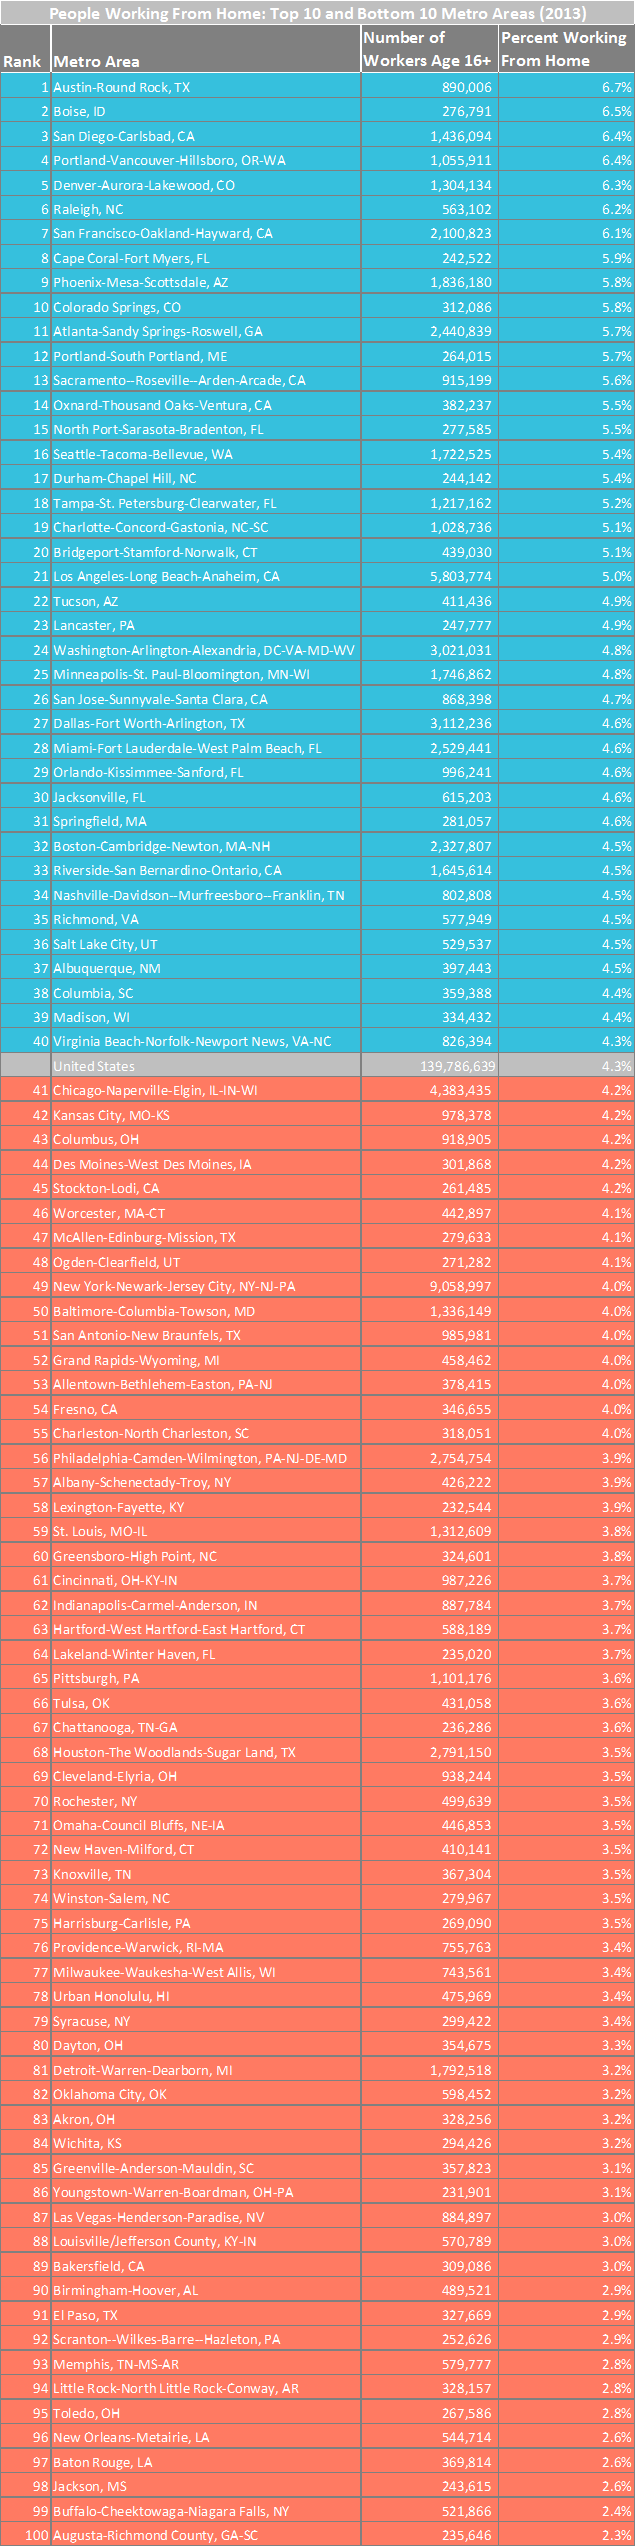
Source: US Census Bureau, American Community Survey 5-Year Estimates (2013).
The only exception to this rule I’ve uncovered so far (and please help me if there are more) is found in military communities. Not shown on the above list, but shown in the table below (because they don’t fall within the 100 largest metro areas) are places like Manhattan, KS (9.7% working from home) Columbus, Georgia (8.2% working from home), and Lawton, Oklahoma (7.6% working from home). Each of these metro areas has a major military presence, and my guess would be that military spouses account for the high level of work-from-home in these places.
Please tell me. Is this too simplistic? Or could this be the holy grail for measuring quality of place within a given city or metro area? There’s plenty more I could write about on this topic, but I’ll leave it here for now. Really looking forward to everyone’s feedback on this one…
Lastly, for the true data geeks, here is an unformatted table showing the percentage of people who work from home in every metro area (381 of them to be exact).
| Rank | Metro Area | Number of Workers Age 16+ | Percent Working From Home |
| 1 | Boulder, CO | 156,493 | 11.2% |
| 2 | Manhattan, KS | 49,946 | 9.7% |
| 3 | Santa Fe, NM | 68,236 | 8.5% |
| 4 | The Villages, FL | 20,170 | 8.4% |
| 5 | Columbus, GA-AL | 129,504 | 8.2% |
| 6 | Corvallis, OR | 38,982 | 8.1% |
| 7 | Bend-Redmond, OR | 68,032 | 7.8% |
| 8 | Pensacola-Ferry Pass-Brent, FL | 197,972 | 7.7% |
| 9 | Lawton, OK | 59,672 | 7.6% |
| 10 | Medford, OR | 83,392 | 7.4% |
| 11 | Fort Collins, CO | 153,688 | 7.1% |
| 12 | Prescott, AZ | 80,247 | 7.0% |
| 13 | Kahului-Wailuku-Lahaina, HI | 77,041 | 6.9% |
| 14 | San Luis Obispo-Paso Robles-Arroyo Grande, CA | 121,124 | 6.9% |
| 15 | Jacksonville, NC | 86,634 | 6.8% |
| 16 | Kingston, NY | 83,780 | 6.8% |
| 17 | Santa Rosa, CA | 225,640 | 6.8% |
| 18 | Austin-Round Rock, TX | 890,006 | 6.7% |
| 19 | Charlottesville, VA | 99,216 | 6.7% |
| 20 | Naples-Immokalee-Marco Island, FL | 129,802 | 6.7% |
| 21 | Santa Cruz-Watsonville, CA | 124,909 | 6.7% |
| 22 | Bremerton-Silverdale, WA | 115,821 | 6.6% |
| 23 | Boise City, ID | 276,791 | 6.5% |
| 24 | Bellingham, WA | 94,736 | 6.4% |
| 25 | Coeur d’Alene, ID | 61,378 | 6.4% |
| 26 | Ithaca, NY | 48,129 | 6.4% |
| 27 | Portland-Vancouver-Hillsboro, OR-WA | 1,055,911 | 6.4% |
| 28 | San Diego-Carlsbad, CA | 1,436,094 | 6.4% |
| 29 | Burlington-South Burlington, VT | 112,633 | 6.3% |
| 30 | Denver-Aurora-Lakewood, CO | 1,304,134 | 6.3% |
| 31 | Eugene, OR | 149,847 | 6.3% |
| 32 | Albany, OR | 47,581 | 6.2% |
| 33 | Grants Pass, OR | 27,940 | 6.2% |
| 34 | Raleigh, NC | 563,102 | 6.2% |
| 35 | St. Cloud, MN | 98,566 | 6.2% |
| 36 | Madera, CA | 41,685 | 6.1% |
| 37 | San Francisco-Oakland-Hayward, CA | 2,100,823 | 6.1% |
| 38 | Chico, CA | 84,086 | 6.0% |
| 39 | Hilton Head Island-Bluffton-Beaufort, SC | 83,202 | 6.0% |
| 40 | Provo-Orem, UT | 225,868 | 6.0% |
| 41 | Cape Coral-Fort Myers, FL | 242,522 | 5.9% |
| 42 | Colorado Springs, CO | 312,086 | 5.8% |
| 43 | Phoenix-Mesa-Scottsdale, AZ | 1,836,180 | 5.8% |
| 44 | Redding, CA | 65,892 | 5.8% |
| 45 | Asheville, NC | 188,107 | 5.7% |
| 46 | Atlanta-Sandy Springs-Roswell, GA | 2,440,839 | 5.7% |
| 47 | Mankato-North Mankato, MN | 53,602 | 5.7% |
| 48 | Portland-South Portland, ME | 264,015 | 5.7% |
| 49 | Port St. Lucie, FL | 162,790 | 5.7% |
| 50 | Spokane-Spokane Valley, WA | 227,432 | 5.7% |
| 51 | Manchester-Nashua, NH | 207,090 | 5.6% |
| 52 | Sacramento–Roseville–Arden-Arcade, CA | 915,199 | 5.6% |
| 53 | Barnstable Town, MA | 99,019 | 5.5% |
| 54 | Napa, CA | 64,876 | 5.5% |
| 55 | North Port-Sarasota-Bradenton, FL | 277,585 | 5.5% |
| 56 | Oxnard-Thousand Oaks-Ventura, CA | 382,237 | 5.5% |
| 57 | Wichita Falls, TX | 69,984 | 5.5% |
| 58 | Durham-Chapel Hill, NC | 244,142 | 5.4% |
| 59 | Flagstaff, AZ | 63,296 | 5.4% |
| 60 | Seattle-Tacoma-Bellevue, WA | 1,722,525 | 5.4% |
| 61 | Greeley, CO | 119,502 | 5.3% |
| 62 | Homosassa Springs, FL | 42,854 | 5.3% |
| 63 | Santa Maria-Santa Barbara, CA | 192,480 | 5.3% |
| 64 | Ann Arbor, MI | 166,783 | 5.2% |
| 65 | Missoula, MT | 55,885 | 5.2% |
| 66 | Ocala, FL | 114,497 | 5.2% |
| 67 | Salinas, CA | 176,312 | 5.2% |
| 68 | Tampa-St. Petersburg-Clearwater, FL | 1,217,162 | 5.2% |
| 69 | Bridgeport-Stamford-Norwalk, CT | 439,030 | 5.1% |
| 70 | Charlotte-Concord-Gastonia, NC-SC | 1,028,736 | 5.1% |
| 71 | Eau Claire, WI | 82,541 | 5.1% |
| 72 | Wilmington, NC | 121,244 | 5.1% |
| 73 | Los Angeles-Long Beach-Anaheim, CA | 5,803,774 | 5.0% |
| 74 | Walla Walla, WA | 26,565 | 5.0% |
| 75 | Champaign-Urbana, IL | 112,941 | 4.9% |
| 76 | Lancaster, PA | 247,777 | 4.9% |
| 77 | Punta Gorda, FL | 52,317 | 4.9% |
| 78 | Trenton, NJ | 172,849 | 4.9% |
| 79 | Tucson, AZ | 411,436 | 4.9% |
| 80 | Deltona-Daytona Beach-Ormond Beach, FL | 227,291 | 4.8% |
| 81 | Fairbanks, AK | 49,794 | 4.8% |
| 82 | Grand Junction, CO | 66,170 | 4.8% |
| 83 | Minneapolis-St. Paul-Bloomington, MN-WI | 1,746,862 | 4.8% |
| 84 | Rochester, MN | 108,965 | 4.8% |
| 85 | St. George, UT | 52,697 | 4.8% |
| 86 | Washington-Arlington-Alexandria, DC-VA-MD-WV | 3,021,031 | 4.8% |
| 87 | Blacksburg-Christiansburg-Radford, VA | 80,137 | 4.7% |
| 88 | Fayetteville-Springdale-Rogers, AR-MO | 215,373 | 4.7% |
| 89 | Mount Vernon-Anacortes, WA | 50,280 | 4.7% |
| 90 | Salem, OR | 161,967 | 4.7% |
| 91 | San Jose-Sunnyvale-Santa Clara, CA | 868,398 | 4.7% |
| 92 | Bismarck, ND | 64,101 | 4.6% |
| 93 | Dallas-Fort Worth-Arlington, TX | 3,112,236 | 4.6% |
| 94 | El Centro, CA | 56,590 | 4.6% |
| 95 | Grand Island, NE | 41,851 | 4.6% |
| 96 | Jacksonville, FL | 615,203 | 4.6% |
| 97 | Miami-Fort Lauderdale-West Palm Beach, FL | 2,529,441 | 4.6% |
| 98 | Orlando-Kissimmee-Sanford, FL | 996,241 | 4.6% |
| 99 | Springfield, MA | 281,057 | 4.6% |
| 100 | Wenatchee, WA | 49,407 | 4.6% |
| 101 | Albuquerque, NM | 397,443 | 4.5% |
| 102 | Boston-Cambridge-Newton, MA-NH | 2,327,807 | 4.5% |
| 103 | Glens Falls, NY | 58,921 | 4.5% |
| 104 | Jackson, TN | 54,066 | 4.5% |
| 105 | Janesville-Beloit, WI | 73,101 | 4.5% |
| 106 | Logan, UT-ID | 57,603 | 4.5% |
| 107 | Nashville-Davidson–Murfreesboro–Franklin, TN | 802,808 | 4.5% |
| 108 | Norwich-New London, CT | 136,625 | 4.5% |
| 109 | Palm Bay-Melbourne-Titusville, FL | 223,072 | 4.5% |
| 110 | Richmond, VA | 577,949 | 4.5% |
| 111 | Riverside-San Bernardino-Ontario, CA | 1,645,614 | 4.5% |
| 112 | Salt Lake City, UT | 529,537 | 4.5% |
| 113 | Sebastian-Vero Beach, FL | 50,953 | 4.5% |
| 114 | Wausau, WI | 68,243 | 4.5% |
| 115 | Columbia, SC | 359,388 | 4.4% |
| 116 | Dubuque, IA | 48,988 | 4.4% |
| 117 | Gainesville, GA | 79,317 | 4.4% |
| 118 | Madison, WI | 334,432 | 4.4% |
| 119 | Sherman-Denison, TX | 51,664 | 4.4% |
| 120 | Sierra Vista-Douglas, AZ | 49,581 | 4.4% |
| 121 | State College, PA | 71,346 | 4.4% |
| 122 | Watertown-Fort Drum, NY | 52,949 | 4.4% |
| 123 | Yuba City, CA | 61,010 | 4.4% |
| 124 | Anchorage, AK | 191,350 | 4.3% |
| 125 | Green Bay, WI | 153,871 | 4.3% |
| 126 | Morgantown, WV | 60,674 | 4.3% |
| 127 | Virginia Beach-Norfolk-Newport News, VA-NC | 826,394 | 4.3% |
| 128 | Chicago-Naperville-Elgin, IL-IN-WI | 4,383,435 | 4.2% |
| 129 | Columbus, OH | 918,905 | 4.2% |
| 130 | Des Moines-West Des Moines, IA | 301,868 | 4.2% |
| 131 | Grand Forks, ND-MN | 52,912 | 4.2% |
| 132 | Harrisonburg, VA | 58,082 | 4.2% |
| 133 | Kansas City, MO-KS | 978,378 | 4.2% |
| 134 | La Crosse-Onalaska, WI-MN | 70,340 | 4.2% |
| 135 | Lewiston, ID-WA | 27,151 | 4.2% |
| 136 | Modesto, CA | 196,796 | 4.2% |
| 137 | Olympia-Tumwater, WA | 116,438 | 4.2% |
| 138 | Rapid City, SD | 68,232 | 4.2% |
| 139 | Reno, NV | 200,090 | 4.2% |
| 140 | Stockton-Lodi, CA | 261,485 | 4.2% |
| 141 | Athens-Clarke County, GA | 83,577 | 4.1% |
| 142 | Billings, MT | 81,443 | 4.1% |
| 143 | Bloomington, IN | 73,825 | 4.1% |
| 144 | Cedar Rapids, IA | 133,060 | 4.1% |
| 145 | East Stroudsburg, PA | 73,547 | 4.1% |
| 146 | Jonesboro, AR | 51,581 | 4.1% |
| 147 | Las Cruces, NM | 86,740 | 4.1% |
| 148 | Lawrence, KS | 59,502 | 4.1% |
| 149 | McAllen-Edinburg-Mission, TX | 279,633 | 4.1% |
| 150 | Ogden-Clearfield, UT | 271,282 | 4.1% |
| 151 | Pittsfield, MA | 60,243 | 4.1% |
| 152 | Sioux City, IA-NE-SD | 83,687 | 4.1% |
| 153 | Tyler, TX | 92,647 | 4.1% |
| 154 | Worcester, MA-CT | 442,897 | 4.1% |
| 155 | Allentown-Bethlehem-Easton, PA-NJ | 378,415 | 4.0% |
| 156 | Baltimore-Columbia-Towson, MD | 1,336,149 | 4.0% |
| 157 | Brunswick, GA | 46,119 | 4.0% |
| 158 | Charleston-North Charleston, SC | 318,051 | 4.0% |
| 159 | Farmington, NM | 51,219 | 4.0% |
| 160 | Fresno, CA | 346,655 | 4.0% |
| 161 | Gainesville, FL | 117,528 | 4.0% |
| 162 | Grand Rapids-Wyoming, MI | 458,462 | 4.0% |
| 163 | Iowa City, IA | 85,173 | 4.0% |
| 164 | Joplin, MO | 77,918 | 4.0% |
| 165 | Merced, CA | 90,630 | 4.0% |
| 166 | New York-Newark-Jersey City, NY-NJ-PA | 9,058,997 | 4.0% |
| 167 | San Antonio-New Braunfels, TX | 985,981 | 4.0% |
| 168 | Springfield, MO | 199,666 | 4.0% |
| 169 | Albany-Schenectady-Troy, NY | 426,222 | 3.9% |
| 170 | Binghamton, NY | 111,143 | 3.9% |
| 171 | Bloomsburg-Berwick, PA | 38,835 | 3.9% |
| 172 | Fort Wayne, IN | 190,951 | 3.9% |
| 173 | Johnson City, TN | 85,107 | 3.9% |
| 174 | Lexington-Fayette, KY | 232,544 | 3.9% |
| 175 | Niles-Benton Harbor, MI | 65,936 | 3.9% |
| 176 | Ocean City, NJ | 42,710 | 3.9% |
| 177 | Philadelphia-Camden-Wilmington, PA-NJ-DE-MD | 2,754,754 | 3.9% |
| 178 | Reading, PA | 191,194 | 3.9% |
| 179 | Salisbury, MD-DE | 162,860 | 3.9% |
| 180 | Yakima, WA | 96,410 | 3.9% |
| 181 | Florence, SC | 82,832 | 3.8% |
| 182 | Greensboro-High Point, NC | 324,601 | 3.8% |
| 183 | Kennewick-Richland, WA | 112,889 | 3.8% |
| 184 | Lansing-East Lansing, MI | 211,184 | 3.8% |
| 185 | Laredo, TX | 93,729 | 3.8% |
| 186 | St. Louis, MO-IL | 1,312,609 | 3.8% |
| 187 | Vallejo-Fairfield, CA | 182,643 | 3.8% |
| 188 | Appleton, WI | 118,155 | 3.7% |
| 189 | Bangor, ME | 71,455 | 3.7% |
| 190 | Burlington, NC | 67,928 | 3.7% |
| 191 | Chambersburg-Waynesboro, PA | 68,454 | 3.7% |
| 192 | Cincinnati, OH-KY-IN | 987,226 | 3.7% |
| 193 | Fargo, ND-MN | 120,749 | 3.7% |
| 194 | Hagerstown-Martinsburg, MD-WV | 114,058 | 3.7% |
| 195 | Hartford-West Hartford-East Hartford, CT | 588,189 | 3.7% |
| 196 | Indianapolis-Carmel-Anderson, IN | 887,784 | 3.7% |
| 197 | Lafayette-West Lafayette, IN | 94,479 | 3.7% |
| 198 | Lakeland-Winter Haven, FL | 235,020 | 3.7% |
| 199 | Muskegon, MI | 66,156 | 3.7% |
| 200 | New Bern, NC | 53,352 | 3.7% |
| 201 | Yuma, AZ | 70,702 | 3.7% |
| 202 | Chattanooga, TN-GA | 236,286 | 3.6% |
| 203 | Duluth, MN-WI | 129,973 | 3.6% |
| 204 | Elizabethtown-Fort Knox, KY | 64,817 | 3.6% |
| 205 | Fond du Lac, WI | 51,880 | 3.6% |
| 206 | Gettysburg, PA | 50,177 | 3.6% |
| 207 | Midland, MI | 36,453 | 3.6% |
| 208 | Pittsburgh, PA | 1,101,176 | 3.6% |
| 209 | Rockford, IL | 151,402 | 3.6% |
| 210 | San Angelo, TX | 53,742 | 3.6% |
| 211 | Savannah, GA | 157,888 | 3.6% |
| 212 | Sioux Falls, SD | 127,198 | 3.6% |
| 213 | Tulsa, OK | 431,058 | 3.6% |
| 214 | Cleveland-Elyria, OH | 938,244 | 3.5% |
| 215 | Columbia, MO | 85,944 | 3.5% |
| 216 | Dover, DE | 72,815 | 3.5% |
| 217 | Harrisburg-Carlisle, PA | 269,090 | 3.5% |
| 218 | Houston-The Woodlands-Sugar Land, TX | 2,791,150 | 3.5% |
| 219 | Idaho Falls, ID | 57,817 | 3.5% |
| 220 | Jefferson City, MO | 69,463 | 3.5% |
| 221 | Kalamazoo-Portage, MI | 146,792 | 3.5% |
| 222 | Knoxville, TN | 367,304 | 3.5% |
| 223 | Lincoln, NE | 161,684 | 3.5% |
| 224 | Midland, TX | 71,687 | 3.5% |
| 225 | New Haven-Milford, CT | 410,141 | 3.5% |
| 226 | Omaha-Council Bluffs, NE-IA | 446,853 | 3.5% |
| 227 | Pocatello, ID | 36,498 | 3.5% |
| 228 | Roanoke, VA | 142,926 | 3.5% |
| 229 | Rochester, NY | 499,639 | 3.5% |
| 230 | Winston-Salem, NC | 279,967 | 3.5% |
| 231 | Cheyenne, WY | 46,840 | 3.4% |
| 232 | Daphne-Fairhope-Foley, AL | 80,619 | 3.4% |
| 233 | Hot Springs, AR | 38,032 | 3.4% |
| 234 | Kankakee, IL | 48,345 | 3.4% |
| 235 | Lebanon, PA | 63,193 | 3.4% |
| 236 | Longview, WA | 38,842 | 3.4% |
| 237 | Milwaukee-Waukesha-West Allis, WI | 743,561 | 3.4% |
| 238 | Myrtle Beach-Conway-North Myrtle Beach, SC-NC | 162,987 | 3.4% |
| 239 | Oshkosh-Neenah, WI | 82,661 | 3.4% |
| 240 | Providence-Warwick, RI-MA | 755,763 | 3.4% |
| 241 | Pueblo, CO | 63,899 | 3.4% |
| 242 | Staunton-Waynesboro, VA | 53,222 | 3.4% |
| 243 | Syracuse, NY | 299,422 | 3.4% |
| 244 | Urban Honolulu, HI | 475,969 | 3.4% |
| 245 | Visalia-Porterville, CA | 163,808 | 3.4% |
| 246 | Dayton, OH | 354,675 | 3.3% |
| 247 | Hickory-Lenoir-Morganton, NC | 152,005 | 3.3% |
| 248 | Lake Havasu City-Kingman, AZ | 66,713 | 3.3% |
| 249 | Springfield, IL | 102,207 | 3.3% |
| 250 | Utica-Rome, NY | 129,459 | 3.3% |
| 251 | York-Hanover, PA | 209,726 | 3.3% |
| 252 | Akron, OH | 328,256 | 3.2% |
| 253 | Crestview-Fort Walton Beach-Destin, FL | 111,635 | 3.2% |
| 254 | Davenport-Moline-Rock Island, IA-IL | 178,565 | 3.2% |
| 255 | Detroit-Warren-Dearborn, MI | 1,792,518 | 3.2% |
| 256 | Lubbock, TX | 138,948 | 3.2% |
| 257 | Lynchburg, VA | 113,066 | 3.2% |
| 258 | Oklahoma City, OK | 598,452 | 3.2% |
| 259 | Sheboygan, WI | 57,547 | 3.2% |
| 260 | South Bend-Mishawaka, IN-MI | 139,590 | 3.2% |
| 261 | Tallahassee, FL | 168,710 | 3.2% |
| 262 | Topeka, KS | 109,352 | 3.2% |
| 263 | Wichita, KS | 294,426 | 3.2% |
| 264 | Bloomington, IL | 95,172 | 3.1% |
| 265 | Flint, MI | 154,481 | 3.1% |
| 266 | Greenville-Anderson-Mauldin, SC | 357,823 | 3.1% |
| 267 | Mobile, AL | 167,552 | 3.1% |
| 268 | Youngstown-Warren-Boardman, OH-PA | 231,901 | 3.1% |
| 269 | Bakersfield, CA | 309,086 | 3.0% |
| 270 | Canton-Massillon, OH | 178,730 | 3.0% |
| 271 | Cleveland, TN | 47,617 | 3.0% |
| 272 | Erie, PA | 125,533 | 3.0% |
| 273 | Gadsden, AL | 38,409 | 3.0% |
| 274 | Great Falls, MT | 39,091 | 3.0% |
| 275 | Hammond, LA | 51,582 | 3.0% |
| 276 | Jackson, MI | 64,118 | 3.0% |
| 277 | Las Vegas-Henderson-Paradise, NV | 884,897 | 3.0% |
| 278 | Lewiston-Auburn, ME | 50,445 | 3.0% |
| 279 | Louisville/Jefferson County, KY-IN | 570,789 | 3.0% |
| 280 | Waterloo-Cedar Falls, IA | 82,431 | 3.0% |
| 281 | Weirton-Steubenville, WV-OH | 51,110 | 3.0% |
| 282 | Winchester, VA-WV | 59,640 | 3.0% |
| 283 | Albany, GA | 59,530 | 2.9% |
| 284 | Ames, IA | 47,948 | 2.9% |
| 285 | Battle Creek, MI | 55,725 | 2.9% |
| 286 | Bay City, MI | 45,213 | 2.9% |
| 287 | Birmingham-Hoover, AL | 489,521 | 2.9% |
| 288 | California-Lexington Park, MD | 53,564 | 2.9% |
| 289 | Casper, WY | 40,009 | 2.9% |
| 290 | College Station-Bryan, TX | 104,391 | 2.9% |
| 291 | El Paso, TX | 327,669 | 2.9% |
| 292 | Longview, TX | 91,275 | 2.9% |
| 293 | Michigan City-La Porte, IN | 46,176 | 2.9% |
| 294 | Monroe, MI | 65,105 | 2.9% |
| 295 | Saginaw, MI | 77,833 | 2.9% |
| 296 | St. Joseph, MO-KS | 57,276 | 2.9% |
| 297 | Scranton–Wilkes-Barre–Hazleton, PA | 252,626 | 2.9% |
| 298 | Altoona, PA | 56,487 | 2.8% |
| 299 | Amarillo, TX | 119,454 | 2.8% |
| 300 | Corpus Christi, TX | 189,189 | 2.8% |
| 301 | Cumberland, MD-WV | 39,791 | 2.8% |
| 302 | Danville, IL | 32,411 | 2.8% |
| 303 | Hanford-Corcoran, CA | 54,277 | 2.8% |
| 304 | Killeen-Temple, TX | 180,015 | 2.8% |
| 305 | Little Rock-North Little Rock-Conway, AR | 328,157 | 2.8% |
| 306 | Memphis, TN-MS-AR | 579,777 | 2.8% |
| 307 | Muncie, IN | 48,945 | 2.8% |
| 308 | Peoria, IL | 173,363 | 2.8% |
| 309 | Racine, WI | 88,292 | 2.8% |
| 310 | Sebring, FL | 30,363 | 2.8% |
| 311 | Toledo, OH | 267,586 | 2.8% |
| 312 | Valdosta, GA | 58,017 | 2.8% |
| 313 | Williamsport, PA | 52,868 | 2.8% |
| 314 | Auburn-Opelika, AL | 64,385 | 2.7% |
| 315 | Carson City, NV | 22,268 | 2.7% |
| 316 | Clarksville, TN-KY | 113,644 | 2.7% |
| 317 | Columbus, IN | 36,749 | 2.7% |
| 318 | Evansville, IN-KY | 146,105 | 2.7% |
| 319 | Fayetteville, NC | 160,790 | 2.7% |
| 320 | Huntsville, AL | 194,422 | 2.7% |
| 321 | Kingsport-Bristol-Bristol, TN-VA | 125,184 | 2.7% |
| 322 | Mansfield, OH | 50,775 | 2.7% |
| 323 | Baton Rouge, LA | 369,814 | 2.6% |
| 324 | Fort Smith, AR-OK | 112,899 | 2.6% |
| 325 | Goldsboro, NC | 52,963 | 2.6% |
| 326 | Jackson, MS | 243,615 | 2.6% |
| 327 | New Orleans-Metairie, LA | 544,714 | 2.6% |
| 328 | Rome, GA | 38,123 | 2.6% |
| 329 | Spartanburg, SC | 130,643 | 2.6% |
| 330 | Victoria, TX | 42,787 | 2.6% |
| 331 | Beckley, WV | 44,407 | 2.5% |
| 332 | Carbondale-Marion, IL | 53,804 | 2.5% |
| 333 | Charleston, WV | 95,694 | 2.5% |
| 334 | Johnstown, PA | 58,663 | 2.5% |
| 335 | Panama City, FL | 82,944 | 2.5% |
| 336 | Wheeling, WV-OH | 62,313 | 2.5% |
| 337 | Buffalo-Cheektowaga-Niagara Falls, NY | 521,866 | 2.4% |
| 338 | Dalton, GA | 58,089 | 2.4% |
| 339 | Elmira, NY | 38,315 | 2.4% |
| 340 | Greenville, NC | 78,363 | 2.4% |
| 341 | Hattiesburg, MS | 62,534 | 2.4% |
| 342 | Kokomo, IN | 33,879 | 2.4% |
| 343 | Rocky Mount, NC | 60,505 | 2.4% |
| 344 | Waco, TX | 109,878 | 2.4% |
| 345 | Atlantic City-Hammonton, NJ | 123,800 | 2.3% |
| 346 | Augusta-Richmond County, GA-SC | 235,646 | 2.3% |
| 347 | Bowling Green, KY | 70,945 | 2.3% |
| 348 | Brownsville-Harlingen, TX | 139,234 | 2.3% |
| 349 | Elkhart-Goshen, IN | 86,930 | 2.3% |
| 350 | Huntington-Ashland, WV-KY-OH | 141,017 | 2.3% |
| 351 | Montgomery, AL | 159,034 | 2.3% |
| 352 | Odessa, TX | 64,364 | 2.3% |
| 353 | Owensboro, KY | 49,690 | 2.3% |
| 354 | Parkersburg-Vienna, WV | 38,265 | 2.3% |
| 355 | Terre Haute, IN | 72,404 | 2.3% |
| 356 | Decatur, IL | 47,407 | 2.2% |
| 357 | Dothan, AL | 60,836 | 2.2% |
| 358 | Lafayette, LA | 211,836 | 2.2% |
| 359 | Lima, OH | 45,170 | 2.2% |
| 360 | Morristown, TN | 46,136 | 2.2% |
| 361 | Pine Bluff, AR | 35,648 | 2.2% |
| 362 | Springfield, OH | 57,263 | 2.2% |
| 363 | Tuscaloosa, AL | 96,481 | 2.2% |
| 364 | Abilene, TX | 72,594 | 2.1% |
| 365 | Cape Girardeau, MO-IL | 43,555 | 2.1% |
| 366 | Houma-Thibodaux, LA | 90,263 | 2.1% |
| 367 | Shreveport-Bossier City, LA | 194,132 | 2.1% |
| 368 | Anniston-Oxford-Jacksonville, AL | 44,746 | 2.0% |
| 369 | Gulfport-Biloxi-Pascagoula, MS | 163,055 | 2.0% |
| 370 | Macon, GA | 89,912 | 2.0% |
| 371 | Beaumont-Port Arthur, TX | 162,407 | 1.9% |
| 372 | Florence-Muscle Shoals, AL | 59,579 | 1.9% |
| 373 | Warner Robins, GA | 78,864 | 1.9% |
| 374 | Decatur, AL | 63,733 | 1.8% |
| 375 | Lake Charles, LA | 86,158 | 1.8% |
| 376 | Monroe, LA | 72,930 | 1.8% |
| 377 | Sumter, SC | 43,002 | 1.7% |
| 378 | Hinesville, GA | 33,778 | 1.6% |
| 379 | Texarkana, TX-AR | 60,005 | 1.6% |
| 380 | Alexandria, LA | 59,596 | 1.5% |
| 381 | Vineland-Bridgeton, NJ | 59,619 | 1.3% |
Source: US Census Bureau, American Community Survey 5-Year Estimates (2013).
John Karras believes that all communities have the potential to become more vibrant. John’s professional passions are aligned at the three-way intersection of urban planning, economic development and transportation policy. John founded urbanSCALE.com to empower urban planning and economic development professionals with the knowledge and tools needed to make their communities more vibrant. John is also the creator of the urbanSCALE Rating System, the first comprehensive measure of how urban a city is on a scale of 1 to 10.


Interesting piece; the concept deserves further analysis. While, in general, people who work at home may have some degree of place mobility, their choice of location for working (even at home) may not always correlate to the place they would most prefer to live. For example, in a two-worker household, one worker may work at home while the other holds a place-specific job. The at-home worker in this case does not have complete freedom of movement. Others may be working at home part time while searching for other full-time employment, which may or may not involve a site-specific venue. Others work at home but depend on social and professional networks that are place-bound – i.e. related to finance in NY metro area, entertainment in LA, tech in SF, etc. I suspect that the earlier one is in one’s career, the more these established, place-bound networks matter; someone with 30 years of experience likely has a strong professional network and more flexibility to move about while maintaining steady employment.
I suspect that the numbers may also be skewed by “work at home” attitudes held by the major employers and/or industries in particular metro areas. Some have embraced it; others have tried it and found it wanting; others actively discourage it.
Do your numbers reflect only full-time employees or part-time as well? I know of a good number of retirees who maintain part-time relationships with their previous companies, but work remotely, often from a chosen retirement venue. In this case, they’ve selected the place they want to live and have then continued to work, but the retirement venue dominates the decision, not the option to keep working.
I also know of examples where family obligations -taking care of aging parents- force people to move to locations they don’t consider optimal, but who are able to maintain their jobs through “remote work.”
As noted, it’s an interesting premise; as noted, I’d love to see more analysis.
James-
Thank you for all of the feedback. You raise some valid points. And I agree with you it’s worth further analysis. Admittedly, there is no true “holy grail” data point that perfectly measures quality of place. But the idea is that the percent of people working from home does tell you something about a given place. And if you have a relatively large city or MSA with a much higher percentage of people working from home than the US average, it makes sense that a good portion of those people are there because they love the place.
As you mention, there are all sorts of reasons why people work from home…many of which have nothing to do with quality of place. But, there is no denying that the labor market has changed dramatically in the last couple decades thanks to a combination of technology & cultural factors. And this is enabling more people to work from home. If anything, this data point may become an even better measure of quality of place in the coming years as more people & companies adapt to the new economic realities. Some of your questions remain unanswered. For instance, I hadn’t thought of the retiree angle. That might explain why Cape Coral-Fort Myers, FL ranks so high on this list.
Another interesting area to explore would be the differences within metro areas. My initial look suggests that more urban places (central cities) tend to have a higher percentage of work-from-home than less urban places (suburbs & exurbs). Lots more to dive into. Thank you again for your insights.
Nice article John, I enjoyed it and it makes a great deal of sense.
As someone who works from home, I think the only thing that is missing is a way to control for cost of living. I earn $1 whether I am living in rural Nebraska or New York City. Typically, salaries for traditional jobs are adjusted based on the cost of living. So if a person accepts a job for a similar position in San Francisco or NYC, then they can expect a raise, but that is not the case for an at-home worker moving to these expensive cities.
I have been going through the process of deciding where to live next and I can’t simply choose to live in what I deem the best city. I cannot afford San Francisco otherwise it would be my top choice. I need to factor in cost of living as well. Thus, I have decided on Austin (as are many others apparently), as a compromise between a more affordable cost of living, but also being a great city.
Your list would be perfect if it could somehow be tweaked to reflect cost of living. The fact that San Francisco is so expensive, yet is still #7 on your list is pretty amazing and probably shows that San Francisco is the most appealing city in America. On the other end of the spectrum, I think cities that are seen as “hidden gems” i.e. relatively cheap compared to the city’s quality get an artificial bump on your list. Perhaps that is why Boise is so high? I could see it being the case that people working from home on the west coast would prefer to live in Seattle, Portland, SF, etc., but end up in Boise because of its’ affordability.
Greg-
I really like your take on the reality of how people chose where to live, especially since you’re going through the process right now. And congrats on choosing Austin by the way! It is a special place and there are some good reasons why it’s the fastest growing large city in the US (although I’m questioning my choice of living here at the moment when the heat index is in the mid 90s at 11pm!).
Nonetheless, you bring up some great points about cost of living. One could perhaps even make the argument that simply the most expensive places are those with the highest quality of place, because people are paying a premium to live there. But your point about San Francisco makes sense…if it is one of the most expensive places to live, and there are still a disproportionately high number of people choosing to live there when they could live in a cheaper place (like Boise, or even Austin or Phoenix or Denver, etc) then it really must be one of the most appealing places.
Thank you for sharing your thoughts!
It’s a novel concept, but there are a couple problems with using this metric.
First is that it will strongly correlate with the industrial mix of employment in a given city or MSA. Working from home is something that is more likely to be done by advanced professional services or information-based occupations that do not require a physical presence or face-to-face interaction. However, an urban economy that is based more heavily on blue collar jobs will have fewer people working from home because those workers typically must be physically present at the site of production. In this case, quality of place can be something entirely unrelated to working from home.
Second, the Census reports on commuting states that nearly half of the people who work from home are self-employed. However, the Census data doesn’t indicate whether self-employed people have a preference for working from home or off-site. It may very well be that they want to have a small office away from home, but they are being outbid by firms with greater resources who place a higher premium on commercial space due to economies of scale or agglomeration economies. In this case, the benefits of either are typically not going to be captured by a one-man operation to an extent that outweighs the cost of renting commercial space (even if sharing space with other one-man operations).
Andrew-
Really appreciate your comments. And you’re right that it’s not a perfect measure. In response to your first point (that urban economies based largely on blue collar jobs will, by definition, not have as many people working from home), this is true. But I would argue that the mere fact that certain markets (like Austin, Silicon Valley, or Boulder) have economies that are largely based on professional and information-based occupations, is an indicator of their high quality of place. This is because professional firms & tech firms are more “footloose” than production-based industrial firms. Companies with large professional and technology-driven workforces go to where the talent is. And the talent (highly skilled, highly educated workers) is in the places that are more desirable.